John Egan takes a look at the complexities entailed in answering the question.
If you would like to know how well off you are, you do not have to look far – just look to your neighbours.
A study published late last week by the Office for National Statistic (ONS) has done just this, comparing disposable income across selected regions of Europe. Differences in this indicator of wealth are shown to depend on regional productivity and levels of employment, together with income redistribution through tax and benefits systems.
The ONS study, unsurprisingly, finds that regions with both high productivity and employment have the highest disposable household incomes per head. In the United Kingdom, London, the south-east and east are doing well, alongside the most prosperous regions in Germany, France and Italy.
However, getting the right mix of productivity, employment and redistribution is a conundrum that each country approaches differently. There is much to be discovered by looking at our neighbours.
The above interactive graphic shows how productivity – the creation of value by each worker – differs across the selected regions of Europe. The Hautes-de-Seine (right), a region that wraps around Paris, is more than twice as productive as the UK average, followed by inner London-west at 62 per cent.
At the other end of the spectrum are many red dots that comprise the productive laggards of the UK regional economies, mixing with similar regions of Italy and Germany. France and Spain, on the other hand, are largely clustered around the average productivity of the UK.
So much for the creation of value, but who is creating it? Employment rates across the regions tell an interesting story.
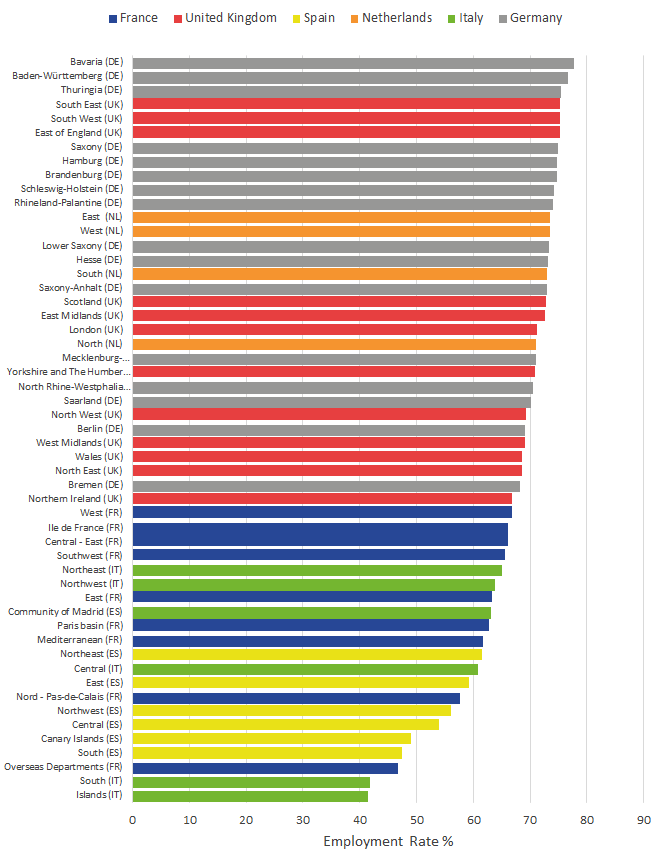
Employment rates in selected European regions in 2014. Credit: ONS
The top 32 regions of Europe for level of employment in 2014 were in the UK, Germany and the Netherlands. France, Spain and Italy filled the bottom of the chart.
In the UK, employment levels are now so high that in some regions most people can find themselves a job – even though they may not be the most productive. Conversely, in areas of high unemployment, employment is more likely for the more productive individuals. It is the low productivity companies – the so-called zombies – that pull down their regional productivity, as productive individuals can become trapped in low productivity environments.
So, the end result – also taking into consideration the income redistribution through tax and benefits (not including the in-kind benefits of education and health care) – sees the disposible income of UK households well mixed in with their continental neighbours.
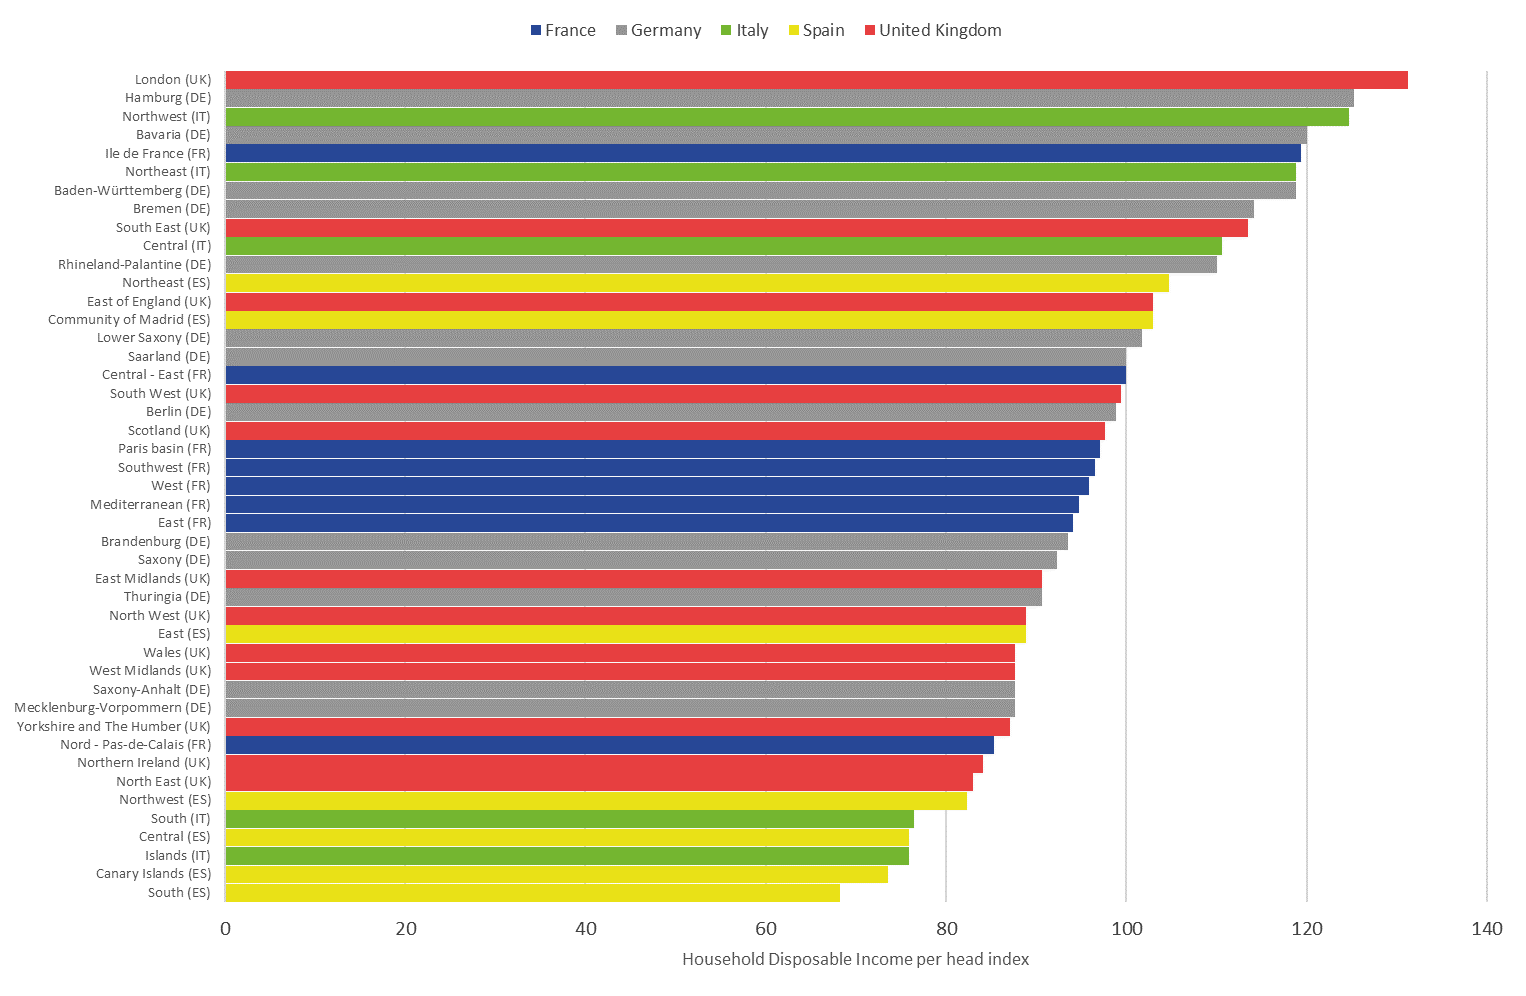
Net disposable household income per head in selected European regions in 2014. Credit: ONS
Regions of Spain and Italy, among others, continue to suffer from high levels of unemployment, particularly among the young. This remains an unresolved tragedy.
Elsewhere in Europe there is quite a mix of regions filling the top places of highest disposable income, despite their nations varying mix of policies to encourage productivity and employment. An economic convergence on a European scale is apparent.
Policies and practices to encourage innovation should impact at a regional level and will appear in a follow-up article in Chief-Exec.com. Also, the free movement of labour throughout Europe is a factor in this continental economy. The effects of Brexit on the above statistics are particularly difficult to predict.
In the end it will depend on how the UK reconstitutes its relations with its neighbours.
Note
Regional data for France, Germany, Italy, the Netherlands and Spain are taken from the Eurostat website, where comparable data are collated from all the EU countries. Different countries are selected in order to make the national comparisons as valid as possible. Regions are split and selected to provide areas with broadly comparable populations. Labour productivity is measured as gross domestic product (GDP) per worker, where GDP is measured at current prices and expressed at the purchasing power standard (PPS) to avoid distortions arising from different price levels across countries. Employment and household income data for the Netherlands have not been included due to concerns about the comparability with data from other counties. For further information on data selection and its potential pitfalls see: Regional and subregional productivity comparisons, UK and selected EU countries: 2014

Headline Photo: NASA images/Shutterstock.com