What factors govern the distribution of wealth between individuals in today’s modern societies? In the first part of our chief-exec.com digest of the French economist, Thomas Piketty’s, Capital in the 21st Century we indicated that an answer emerges from what happened in the 50 years after 1915, which were quite exceptional in the economic history of the world. Two world wars and an intervening Great Depression, together with special taxation for post-conflict reconstruction, led to an unprecedented fall of the value of global capital assets.
During this relatively brief, but tumultuous period, the economic status quo that had been in place for centuries was overturned. Wealthy individuals who did not lose capital assets directly often had to deplete these to retain the affluent lifestyle that their reduced return of investment could not sustain. The earning power of labour superseded that of capital allowing a new group of salaried managers to enter the ranks of the capital accumulating class. It was as if the pack of economic assets had been shuffled and re-dealt to ancient and nouveau rich alike.
The result of this monumental change is seen in the chart below.
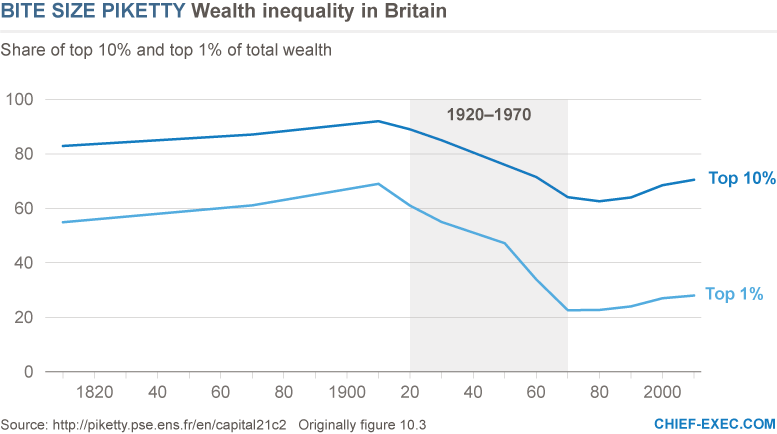
Figure 10.3 (this number corresponds to its place in Capital in the 21st Century) shows the fraction of total wealth in the UK that is owned by the wealthiest 1 per cent and 10 per cent of the population. Reliable data of this type also exists for France and Sweden and each shows a similar pattern. This is notable in itself given the political differences between the countries. France had a revolution and an emperor around the beginning of the chart! It indicates that forces beyond those of national government may be acting to determine this common behaviour.
Piketty explains the observed behaviour as follows. Throughout history – up to 1910 – the annual return on invested capital typically remained at about 4-5 per cent and minimal (if any) taxes were applied to capital ownership. In contrast, economic growth had been negligible for centuries and remained below 2 per cent even during the industrial revolution. Such an invariable and significant dominance of the earning power of capital over labour over centuries is a recipe for an eventual massive concentration of capital. The rich becoming richer, as a simple consequence of this mathematical inequality, reached a point where more than 90 per cent of the UK’s national capital was owned by 10 per cent of the population by 1910.
Following this apogee, the destruction of capital and its taxation described above is seen in the declining proportions of the richest 1 per cent and 10 per cent, the former being the most adversely affected, with their fortunes declining from 60 per cent to almost 20 per cent of the total national asset value in 50 years.
As actual national wealth was in decline (see No.1 in this series), the richest were effected disproportionately. However, after 1970 the level of national wealth began to be restored in all countries so that by 2010 it was again approaching six times national income as it had been throughout most of the 19th century. Yet the sharing out of this newly accumulated capital was not as before. Today, the 50-89 per cent of the population according to their wealth, who previously owned less than 10 per cent of national assets, have seen their holding grow to 25-30 per cent, – at the expense of the richest fractions – particularly the very rich. Piketty refers to this new group as the patrimonial middle class and they are a novel feature of contemporary society, and one for which the impact and destiny is largely unknown.
The wealthy patrimonial middle class identified by Piketty is a large and important group for business and politicians. It is possible that they may become a permanent feature of modern society through a structural change caused by the shocks of the 20th century and preserved through favourable policy, together with their saving and inheritance behaviour (more on this later). As national governments chase competitor countries with lower corporate taxes to encourage businesses to start-up or relocate, the trend for taxes on capital to approach their historic lows seems set to continue. So then will the trends in Figure 10.3.
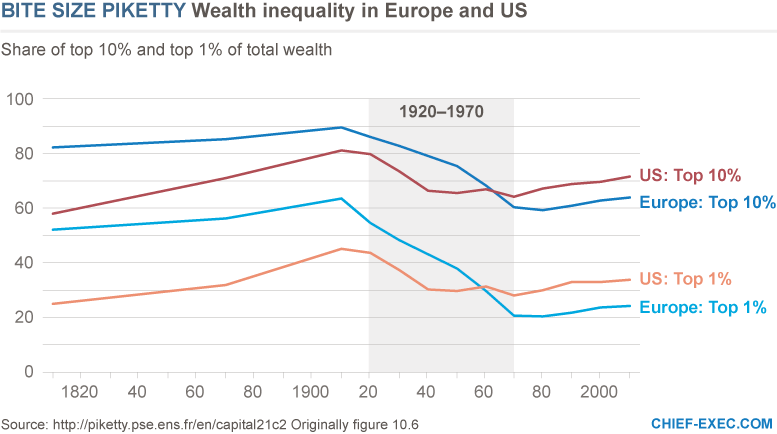
Finally, it is interesting to note that the above trends that apply to European economies appear to follow a somewhat different trajectory in the US, due to a different history and geography for that nation. Figure 10.6 shows the US starts with a much more egalitarian society up to 1915. Less time for the accumulation of capital in this relatively new nation can explain this. Then the shocks of the 20th century appear less profound, as the US did not suffer the same physical destruction as most of Europe. The rebound after 1970 also seems to follow the European pattern, but from a higher starting point. Taken together these stages have led today to a more inegalitarian society in the US to that found in Europe, again not by any specific policy measures but simply by taking into account the depth of the shocks of the 20th century and their aftermath.
It is salutary that the answer to the important question we began with should depend on the ripples of events half a lifetime ago.
by John Egan