
Here we present our exclusive analysis of the impact of Covid-19 on eight countries plus the entire World. We have followed daily infection rates since the start of the pandemic to the present day. Waves of infection brought about the conditions for an effective cooling of the virus. We seek to explore this relationship to better understand how the virus can be defeated.
This update follows on from that published on January 11.
How to interpret the charts
Our analysis of the SARS-CoV-2 epidemic treats the virus like a gas that is expanding through the world. Molecules of gas collide during expansion and these events are analogous to the social contact between people. Further background can be found in an introductory article to the Chief-Exec.com Covid Analytics platform.
A virus needs energy to reproduce and propagate, which it draws from the people it infects. Energy will only flow to the virus when this is colder than its supply – heat flows from hot to cold. We can estimate a temperature for the virus itself, not the infected person, using a measure we call MB Temp.
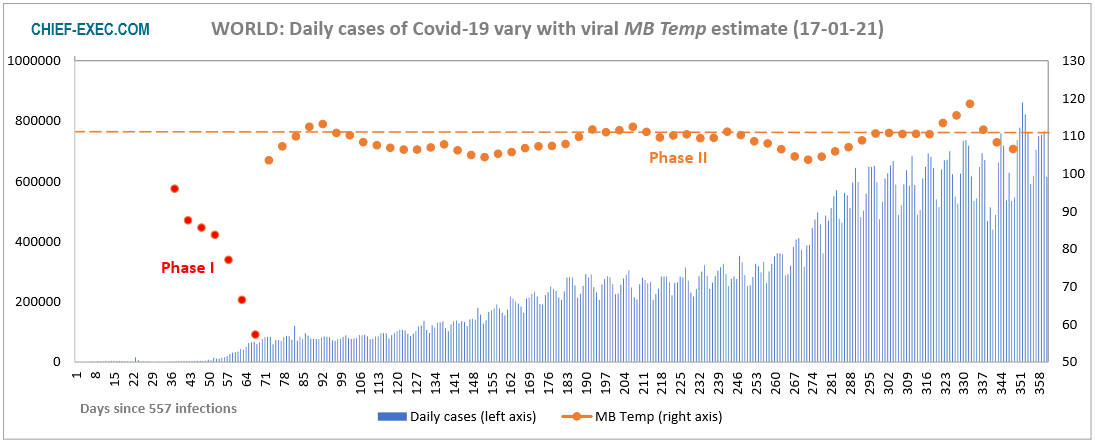
When MB Temp is below 111, a level which is shown as a dashed line on the charts below, the epidemic expands. Above 111, energy flow is suppressed leading to a fall in the number of daily infections, shown on the charts by thin blue lines following the left axis.
Colder viral temperatures may also lead to a phase change, like a gas becoming a liquid, shown as the change from the brown to the cooler red dots on the charts. The latter mark episodes of exponential growth of the epidemic. It is by finding new people to infect that the virus is able dissipate the energy it receives and to cool itself.
All barriers that inhibit infection, from mask wearing and social distancing to lockdowns and vaccines, reverse this viral cooling effect. To varying degrees these measures increase MB Temp and when this passes through the 111 threshold, the expansion of the epidemic goes into reverse. The higher the MB Temp is, the sharper is the drop off of daily infections.
To estimate MB Temp for a country or region, we take 25 days of infection data and fit to this our computer simulation of infections with the consequential energy flows into the virus. There is always an error between real world data and such a simulation, but when this error is small and is a minimum for all possible simulations, the corresponding MB Temp is taken as the best estimate.
Each dot on the charts here therefore represents this best MB Temp estimate with the 25-day simulation started usually at five-day intervals.
The charts below show the relationship of the number of daily infections with MB Temp estimated from the beginning of the epidemic in each country and region analysed.
Featuring Israel

For four consecutive days last week, Israel chalked up over 1,000 daily new confirmed casses of Covid-19 per million people. Today, the country temporarily leads the world on this particular metric, according to Our World in Data.
The passage of Israel through the pandemic has been a roller coaster journey. There have been periods of softened constraints on society that led to further viral outbreaks, interspersed with periods of strict confinement, which raised MB Temp values higher than in most other countries and which successfully and rapidly brought the epidemic under control. This history included the appearance of two deleterious Phase I transitions following the first lockdown.
Most recently, falling values of MB Temp over 80 days have seen the re-emergence of another vertiginous wave of the Covid-19 disease, with the effects of the third lockdown, which was put in place on December 27, possibly just becoming apparent in the latest MB Temp estimate. However, this has been accompanied by another record breaking performance with more than 20 per cent of its population of 9.29 million having so far received the Pfizer-BioNTech vaccine.
France
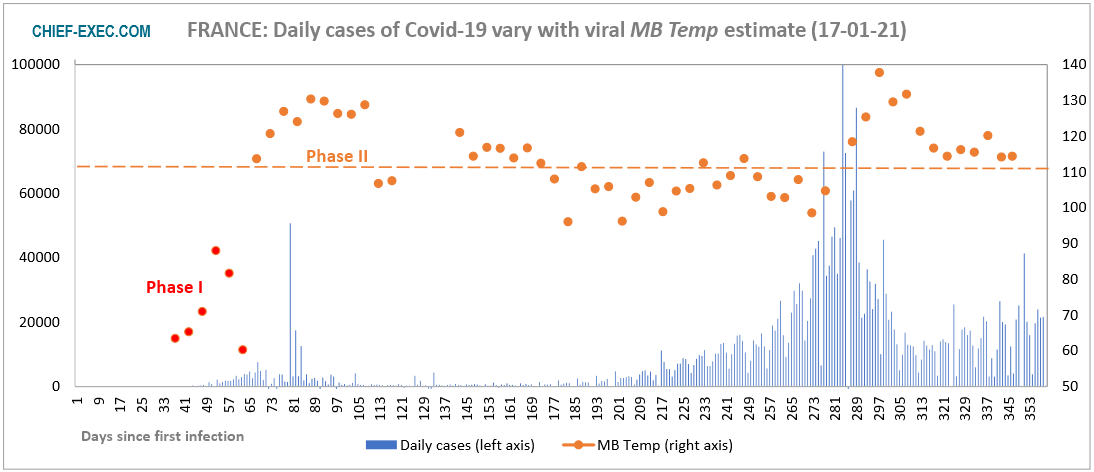
Click graphic to enlarge, back button to return
No significant changes in France have appeared since our previous report.
For 60 days France has seen its MB Temp estimate stay above 111. However, its close proximity to this threshold indicates there is little downward pressure on the daily inventory of new Covid-19 cases, which remains almost stable at about 18,000 cases, although this number is drifting higher. In order to counter this trend, the French Government is hoping that an extension by two hours of a national curfew, to begin at 6pm, will have its desired effect. The impact of any curfew, and whether it should be lengthened, is the subject of much scientific debate.
Germany
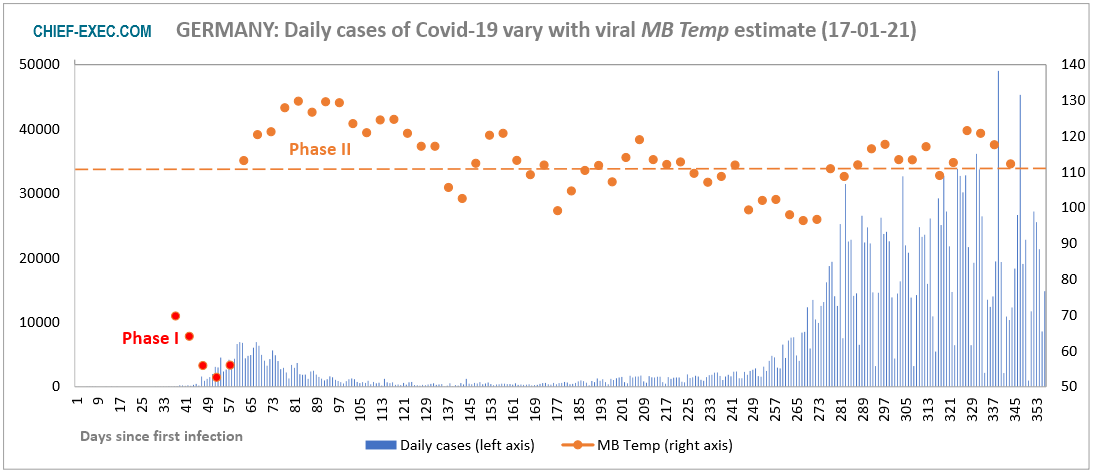
Click graphic to enlarge, back button to return
Germany also continues to show a stable level of Covid-19 infections, this time at about 20,000 cases per day, as it has done for the last 60 days. As with France, MB Temp estimates remain just above the 111 threshold and consequently there is a lack of pressure to push down on this plateau of daily infections.
Earlier indications that the confinement measures that Germany introduced on December 16 may be working seem premature and there is a political consensus emerging that a further tightening of lockdown will be required, perhaps to reduce contagion through workspaces.
Ireland
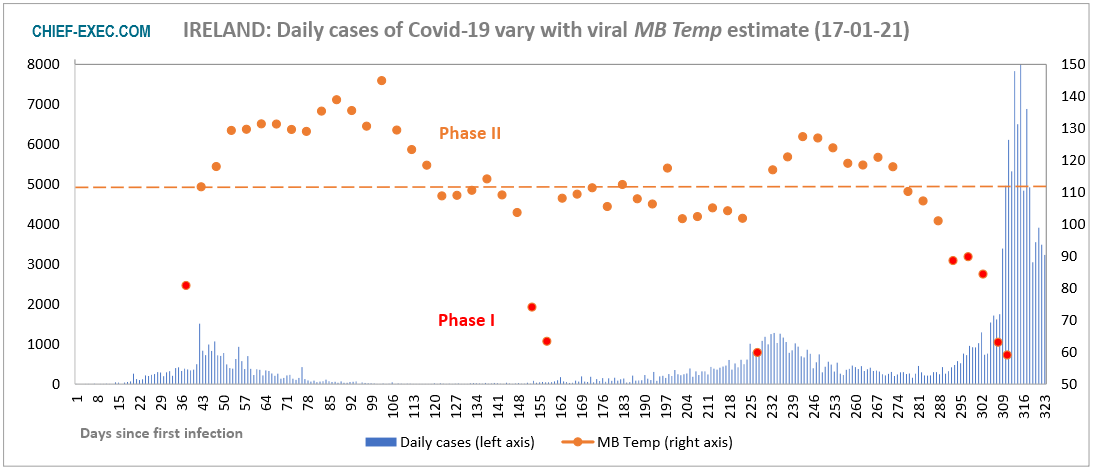
Click graphic to enlarge, back button to return
The degradation caused by the Covid-19 epidemic in Ireland continues. The country now has the most rapidly increasing incidence of Covid-19 in Europe and one of the worst in the world, with confirmed cases doubling every 21 days according to Our World in Data.
The confinement measures introduced at the start of 2021 are beginning to show their effects with a 45 per cent reduction of daily confirmed cases of Covid-19 over the past seven days. Looking back, it appears that socialising over the Christmas period may have been, at least in part, responsible for the “shocking rise in infection rates” in Ireland.
Italy

Click graphic to enlarge, back button to return
The situation in Italy is featured in last week’s publication. As with Germany and France, MB Temp estimates continue to sit close to the 111 threshold and, as a result, the level of daily confirmed cases of Covid-19 remains on the previously established plateau.
Italy with 1.61 per cent of the population vaccinated lies in third place of European nations in terms of vaccines administered – behind Denmark and the UK and just ahead of Ireland.
Japan
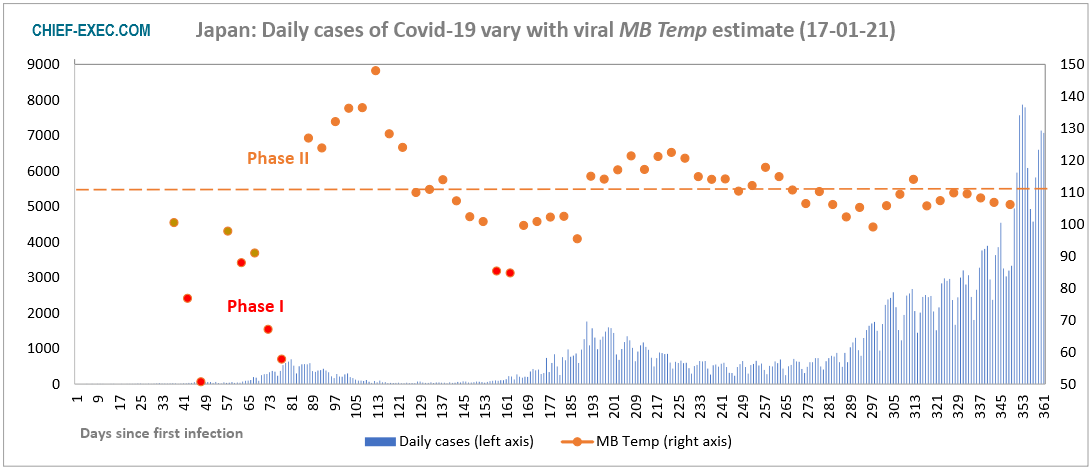
Click graphic to enlarge, back button to return
For the second half of the SARS-CoV-2 pandemic, the behaviour of MB Temp appears very stable in general, including a steady and gradual decline beneath the 111 threshold below which a growth of infections may be expected. Japan has quintessentially followed this rule.
On January 8, Japan recorded 7,863 new cases of Covid-19, its highest daily count since the start of the coronavirus epidemic. On the same day the US registered 292,516 new cases and 3,939 people died – that is 193 people more that all those lost by Japan since the pandemic began.
United Kingdom

Click graphic to enlarge, back button to return
Good news for the UK. The latest estimate of MB Temp pushes this close to the 111 threshold and, if this sharp improvement continues, the UK should soon pass a turning point and see an improvement in the dire situation that is stretching the resources of its National Health Service. As reported in The Guardian, its chief executive Sir Simon Stevens yesterday said: “the facts are very clear and I’m not going to sugar coat them. Hospitals are under extreme pressure and staff are under extreme pressure. Since Christmas Day we’ve seen another 15,000 increase in the inpatients in hospitals across England. That’s the equivalent of filling 30 hospitals full of coronavirus patients and, staggeringly, every 30 seconds across England another patient is being admitted to hospital with coronavirus.”
It is not unrelated that the UK today reported the highest daily coronavirus death rate per million people in the world at 16.5. It is important, therefore, that the UK also leads other European nations by a good distance with nearly 5 per cent of the population initially vaccinated against the SARS-CoV-2 infection, according to Statista.
United States

Click graphic to enlarge, back button to return
There are no appreciable changes to the situation in the United States since our previous report, other than it seems that the country has installed itself below the 111 threshold once again, so that further growth of the epidemic wave may be expected.
Meanwhile, attention is diverted elsewhere with the inauguration of President Joe Biden who, during his first 100 days, plans to see 100 million Americans vaccinated – a goal that Anthony Fauci, the distinguished director of the National Institute of Allergy and Infectious Diseases, says “is absolutely a doable thing”.
The World
Click graphic to enlarge, back button to return
As reported previously, the stable position of the global MB Temp estimate has been restored to its long-standing level just below the 111 threshold.
The next update will be published on Monday 25 January, 2021.
For related articles on Chief-Exec.com : Click Here

Headline Photo Credit: Lightspring/Shutterstock.com
Data sources for the number of SARS-CoV-2 infections are:-
European Centre for Disease Prevention and Control (ECDC)
Johns Hopkins University
This data is retrieved from OurWorldInData.org.