
Today saw the publication of the latest GDP figures for the UK economy. It grew 0.3 per cent over the first quarter of 2017, according to preliminary estimates. Here John Egan introduces a new approach to help understand GDP behaviour.
When you are next walking down the road you might recognise that, with each and every step, about four times the weight of your body is carried momentarily by your leg.
If it were not for the cushioning effects of your shoes and in your tissues and bones, your body would soon wear out. But with each step, your tissues and bones respond with many silent events to dissipate the energy they receive in walking so as to remain intact.
 On your walk you may look through a shop window. A value surface for whatever goods are under your scrutiny may then be elevated along with your perception of their value. These consumer product interactions are also silent events that can mark the crossing of a threshold – when perceived value exceeds their purchase price you choose to buy. With each sale event the value surface would see a small portion of its intrinsic energy similarly dissipated.
You are just one consumer in a national economy. The energy dissipated through your individual consumption is one miniscule fragment of the national consumption that contributes to the Gross Domestic Product (GDP) of your country. Two other GDP components, the Gross Capital Formation (GCF) and balance of trade combine with consumption to create this measure of energy flowing through a national economy[1].
GDP = Total Consumption + Gross Capital Formation + Balance of Trade
This combination of three components provides direct counterparts for the components of the energy dissipative enterprise Chief-Exec.com has considered in previous articles where:-
- Total energy input is the Domestic Demand (Total Consumption + GCF) that is input into an economy over a period of time
- Total energy output is the GDP that is accumulated over that same period of time in response to this input
- The consumption component of output GDP is the revenue derived through sale events with time
- Gross capital formation is the energy retained in the elevated value surface of a representative domestic product also with time
- Balance of trade is the profit/loss made by the national enterprise.
The operation of the energy dissipative economy, which is derived from the energy dissipative enterprise, is shown in the graphic below.
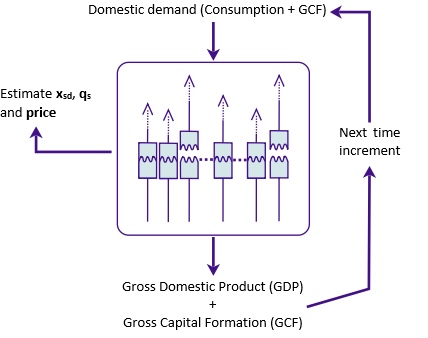
Figure (1): The box represents the energy dissipative economy model which is fitted to real GDP and GCF data over time, to enable the estimation the model parameters that then characterise the UK economy
The time series data of the input (Domestic Demand) and two outputs (GDF and GCF) are all known[2]. With this information we can estimate the values of qs and xsd and the price of a representative national product that together will specify the national economy’s behaviour[3].
Parameter estimation by fitting simulated outputs with their known empirical equivalents – both associated with the same known inputs – is performed using the methods that are used for mechanical energy dissipative systems from which the economic modelling is derived. Importantly, following this approach, it is necessary to fit both GDP data and GCF data separately with time, recognising the former also includes the latter in its composition[4].
Figure (2) shows the energy flow through the UK economy between 2005 and 2015, where the GDP for each year is added to that of the previous year, as are the corresponding data for input domestic demand and the output GCF. This chart shows that with the best-fit estimates of qs and xsd and price, the simulated cumulative GDP and GCF behaviours closely match their real world equivalents.

Figure (2): The fit of the simulation of the energy dissipative economy to the actual UK economic data between 2005 and 2015. The GDP and GCF data is cumulative over the 10-year simulation.
Figure (2) above presents the cumulative GDP and GCF data as this builds up over the 10-year simulation period[5]. The noisy fluctuations familiar in quarterly national accounts disappear in this more long-term view and, for this reason, the energy dissipative simulation can provide a close approximation to the real economic data.
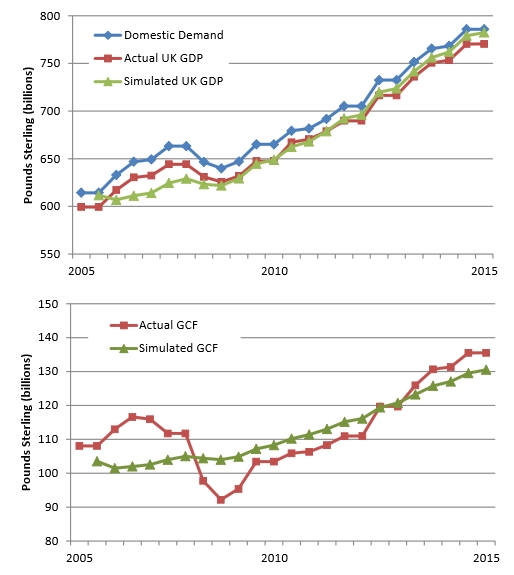
Figure (3): The fit of the simulation of the energy dissipative economy model to the actual UK economic data between 2005 and 2015, where the incremental GDP and GCF data is presented for 24 increments that span the 10-year simulation.
A more familiar economic view of the comparison between simulated and real economic data, using increments of the GDP and GCF variables, rather than their cumulative value, is shown in figure (3).
In figure (3) we see that the simulated economy replicates the actual GDP data reasonably well, with a more approximate match to the actual GCF behaviour[6]. In each case the disruption of the global financial crisis between 2007 and 2010 is also disruptive for the model simulation.
Note, that in figures (2) and (3), both actual and simulated GDP is below the input domestic demand due to a small but persistent deficit in UK balance of trade between 2005 and 2015.
We should recognise that it is reasonable to assume that a nation, unlike an enterprise, should ideally aim to have a zero balance of trade overall[7]. In this case, any national economy should be just sustainable and should sit on (or be close to) the “hockey-stick” sustainability curve that charts qs and xsd values for a range of sustainability scenarios that differ through their level of retained energy, which in this case relates to the GCF.
By fitting the energy dissipative model economy to the real UK economic data between 2005 and 2015, as shown in figure (2), representative values of qs and xsd can be estimated for the UK economy over this period. These are shown in the table below alongside comparable estimates for the three preceding decades.
| Decade | qs | xsd |
| 1975-1985 | 1.052 | 3.887 |
| 1985-1995 | 1.046 | 4.000 |
| 1995-2005 | 1.030 | 4.438 |
| 2005-2015 | 1.023 | 4.855 |
This table then enables one to chart the path that the UK economy has taken along the sustainability curve over the last 40 years.
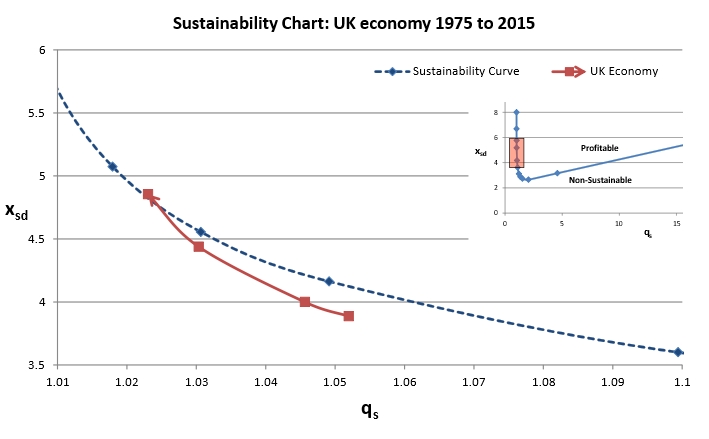
Figure (4): Sustainability Chart showing the parameters that provide the best fit of the energy dissipative economy model to the actual UK economic data between 1975 and 2015. Also shown as an insert is the whole “hockey stick” sustainability curve along which an economy would have a zero balance of trade. The charted area is shown by the pink box
Clearly the UK economy has been travelling in a single direction since it joined what has now become the European Union[8].
How should we interpret this new insight? This needs to be done in comparison with results from other national economies. It will be the subject of next week’s article.
Notes
[1] This provides the expenditure approach to the calculation of GDP. There are also output and income approaches that can be used to reach the same numerical value.
[2] These measures of UK GDP (current prices) and its components have been obtained through the GDP database of the Organisation for Economic Co-operation and Development (OECD).
[3] xsd specifies the spread (standard deviation) of value perceptions across a consumer population. qs governs what happens following a product sale – notably how many other consumers as a consequence begin to appreciate the value of the goods. See here for further explanation.
[4] Without fitting specifically to the GFC data, it would not be possible to estimate parameter qs with any accuracy.
[5] This is typical for the presentation of the properties of a stretched or squashed viscoelastic material. In this case a total force is combined with an elastic equilibrium force component that is due to a strain energy held within the deformed fabric of the material.
[6] There is a bias for a closer fit to the GDP data as the actual values are greater than the comparable GFC data, making the mismatch between simulated and real larger and more influential with the GDP data
[7] There may be temporal factors for nations to run periodic trade surpluses or deficits, for example to build up funds to provide future care for an ageing population (Japan, Germany), or to pass part of a windfall resources boom to succeeding generations (Norway).
[8] Note that residual errors in the fit of the economic model will be reflected in the actual positions of the charted data points. These should be considered approximate but reasonably accurate due to the closeness of fit between model and the real world shown in figure (2).
Follow on twitter: @johnmegan