On the 150th anniversary of the publication of Karl Marx’s Das Kapital, we add our energy-dissipative view of the interactions of labour and capital in the operations of a commercial enterprise.
Boil a kettle or freeze an ice cube and you will have caused water to change phase, from its normal liquid form to become a gas or a solid. This is known as a phase transition and thermodynamics provides the models to understand the science.
It is well known that water normally boils or freezes at a specific temperature. The boiling kettle will remain at 100⁰C until all the liquid water inside has boiled away. Such an abrupt transition is a characteristic of a phase change.
Chief-Exec.com will show that a similar abrupt change appears in the behaviour of a commercial enterprise when an energy stored in its economic fabric reaches a threshold. We will use the recent commercial performance of Amazon.com to demonstrate this by artificially heating up the company to see what happens.
Previously, in Analysis: an Apple that just keeps on rising we described our view of Apple Inc. as an energy dissipative enterprise and now we use the same approach to probe the financial accounts of Amazon.com Inc. between 2007 and 2017, breaking this decade into three 3-year tranches.
One characteristic we are able to estimate through this analysis is the price of a product that can be seen to represent the entire commercial trading of the company and, as expected, this price is found to decrease in a linear fashion as the cycle time tr of the business, denoting the time to convert investment into product sales and reimbursement, is shortened. The slope of this decline of the representative price with tr we refer to as consumptivity and, in the chart below, this is seen to increase between 2007 and 2017 – as the income generation of Amazon.com has progressed over the decade.
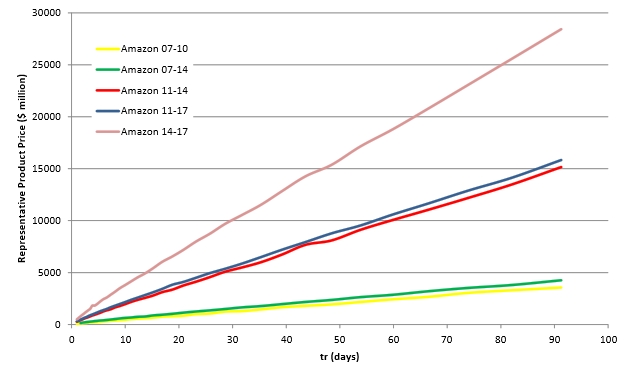
Along each line many simulations of real financial data from Amazon.com, over the intervals shown in the legend, reveal how the price of the representative product varies as the cyclical time of the enterprise simulation tr is shortened.
As already described with Apple Inc, the estimated consumptivity for Amazon.com is reasonably well correlated with the market capitalisation of the company over the three 3-year intervals that have been studied.
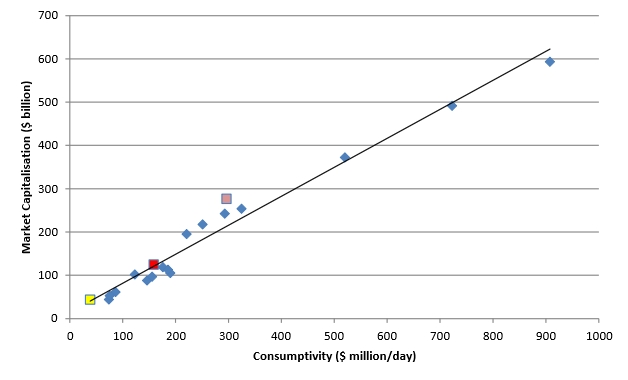
Simulated consumptivity vs actual average market capitalisation of Amazon.com together with comparative companies over time intervals 2007-10 (yellow), 2011-14 (red) and 2014 -17 (mauve)
So far Amazon is behaving as one would expect, primarily because the gross capital formation (GCF) estimated from the company accounts is modest in comparison with the overall investments made during the simulation intervals[1]. The GCF here is equivalent to the energy stored in the dissipative enterprise and it was on average 5.5 per cent, 11.3 per cent and 16.0 per cent of the investments made between 2007-2010, 2011-2014 and 2014-2017 respectively.
Now, we can artificially reduce and elevate the GCF as a percentage of the investments made into Amazon. This is analogous to cooling or heating up the company, in a physical sense, as the energy stored within its financial structures is altered. The consequences are shown below and are surprising.

Reduction of the price estimated for the representative product of Amazon.com between 2014-2017. The 16 simulations differ only in the fraction the gross capital formation (GCF) takes of the overall investment made throughout the simulation period. This fraction varies between 1.6 per cent and 96.2 percent as detailed in the legend on the right.
In the above chart one can see that the linear decline of the price of the representative product continues as normal while GCF is less than about 33 per cent of investment. Then follows a narrow transition zone before the relationship between the price and tr becomes highly non-linear and unpredictable. Indeed, the patterns appear chaotic and are typically sensitive to small variations in the input investment and income data.
Amazon.com appears to sit comfortably in the centre of the stable region.
It must be remembered that the investment and income data remains unchanged throughout the 16 simulations charted above and is precisely the investments made and income received by Amazon between 2014 and 2017. It is only the estimate for GCF conserved within the enterprise that has changed.
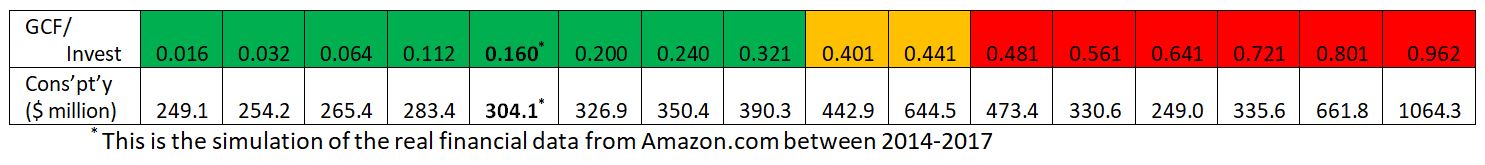
Estimates of consumptivity through this GCF sequence are given in the table above. One can see in the green region with lower GCF/Investment values – when price is decreasing linearly with tr – that there is a proportionate increase in consumptivity as some additional effort is needed to raise the GCF content while at the same time delivering the same income to Amazon. Here, labour dominates in the creation of value. Its effect is a manifestation of the Labour Theory of Value, which is clearly apparent in the linearity of the consumptivity calculation.
In the orange region of the above table, consumptivity grows disproportionately where GCF is around 40 per cent of investment. At times over the past decade Apple Inc. operated in this region of relatively high GCF and in our previous energy dissipative analysis of Apple we needed to apply an intercept adjustment to the consumptivity estimates to compensate for this transitional behaviour.
In the red region of the table capital dominates over labour and the consumptivity, as estimated by the slope of the line that fits through the wandering price:tr behaviour initially falls away. Here capital appears as a dominant factor of value creation. The traces of linearity in the consumptivity calculation have been erased and replaced by a random drift that seems difficult to understand. However, the pattern is not random.
While the chart above shows clearly a random-like behaviour of the individual GCF lines, the trend seen in the table as the behaviour passes from green to red is conserved in other simulations. The green labour dominated region endures until GCF is around 33 per cent of the investment – although specific limits vary. The subsequent decline of consumptivity for higher GCF levels occurs to a greater or lesser degree and the final re-emergence of consumptivity growth, when GCF levels approach actual investment, is likewise conserved.
Conventional ways of assessing the economic contributions of labour and capital – such as the widely used Cobb-Douglas production function – mix these factors in a continuous and cumulative manner to derive their combined effect. There are some similarities between Cobb-Douglas’ and the energy dissipative enterprise analyses[2]. However, the latter suggests that the mixing of capital and labour factors could lead to thermodynamic-like phase changes at certain points of production.
Running a company may be more like boiling a kettle than baking a cake – and for Amazon the water is heating up nicely.

Notes
[1] Investment and revenue data is taken from the company consolidated statements of operations at quarterly intervals available on www.sec.org. The GCF data is also taken quarterly from the company consolidated balance sheets. Normally GCF did not account for depreciation of property, plant and equipment depreciation. However, in the cases of Amazon and Apple the available GCF data was the total asset value net of this depreciation.
[2] Both the Cobb-Douglas production equation and the energy dissipative enterprise analysis are empirically derived and use a least squares method to fit their parameters to empirical data. As a result, both find that normally labour contributes about 66-75 per cent of the energy of economic production, with the remainder provided by the capital component.
Follow on twitter: @johnmegan