
A vaccine may save 10,000 lives in the United States by the spring, but the number of deaths has already surpassed 282,000 and continues to rise, writes John Egan.
Approaching the end of the year, the United States rarely sees a day go by without a dreadful record-breaking Covid-19 statistic. Last week the daily infection rate surpassed 200,000 each day for four days in a row. On Thursday the number of US residents to die from Covid-19 was 2,879 in a single day – a figure close to the number who died in the 2001 9/11 attacks.
Many US district hospitals are full of cases. Several California counties have reinitiated stay-at-home orders that will affect 33 million people. Dr Anthony Fauci, director of the National Institute of Allergy and Infectious Diseases (NIAID), on Friday reminded the country that the latest peak is yet to arrive following social gatherings over the Thanksgiving holiday in late November.
Last week also saw the United Kingdom become the first western country to give regulatory approval for the first SARS-CoV-2 vaccine. Now begins the formidable challenge of connecting the supply chains to deliver the vaccines to those wishing to be vaccinated, starting with those most at risk.
With two shots needed and 31 days in total before immunity can be expected, any vaccine will only have a marginal effect on the coronavirus pandemic over the coming months. It may save 10,000 lives in the US by the spring. But deaths in America yesterday totalled 282,299. The Center for Disease Control (CDC) recently predicted that by December 26 the number would be between 303,000 and 329,000.
This is a mask, not a political statement. Please wear a mask. #FactsFirst pic.twitter.com/qk8jQCnB3M
— CNN (@CNN) October 5, 2020
Clearly, measures to limit the spread of the SARS-CoV-2 virus need to be widely adopted. Last week, President-Elect Joe Biden announced that when he takes the reins of power on January 20, his first step will be to ask Americans to wear a mask for the first 100 days of his presidency. Compliance will be a challenge in a country where wearing a mask is seen by many as a sign of political identity.
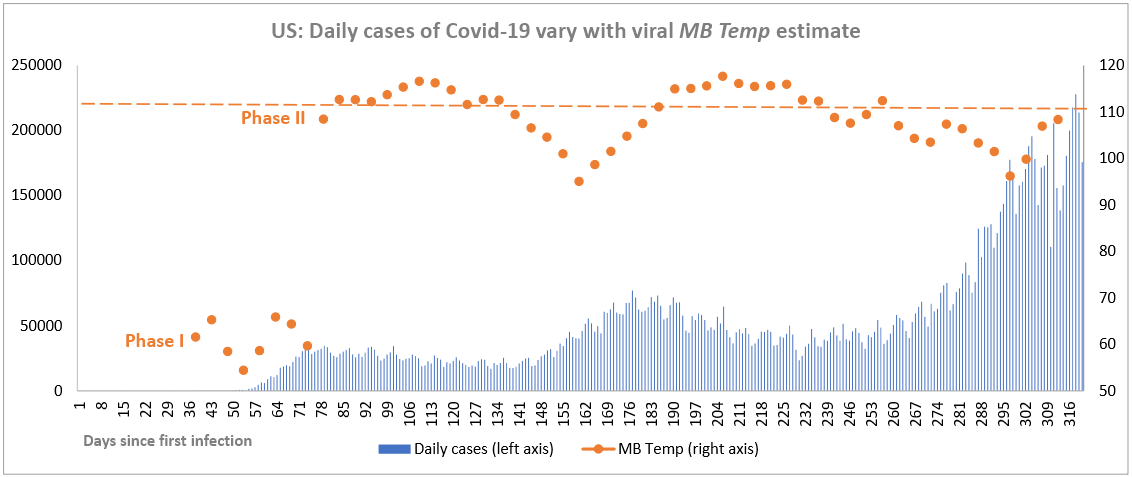
The dashed line gives the level above which MB Temp values are associated with a declining number of daily viral infections
Here, Chief-Exec.com presents the latest analysis of the US coronavirus infection data using a method we have deployed based on how the SARS-CoV-2 coronavirus uses the energy it takes from infected individuals to fuel its propagation.
In this latest analysis, we have shortened the window through which we simulate the epidemic from a 50-day interval to 25 days, which is the shortest feasible to avoid a loss of clarity due to random noise inherent in the data. With this more magnified view, taking a picture every five days, the model parameter MB Temp is seen to be important.
MB Temp effectively provides a temperature measurement that can be associated with the virus itself – not its infected host. Keeping the virus cool attracts the energy that fuels its propagation, in much the same way as keeping a car engine cool enables the car to run. An overheated engine will become less efficient up to the point it ceases to function. The above graph demonstrates that this same thermodynamic consequence may well apply to the virus.
Previously, we have described how MB Temp values appear to switch between two distinct phases, like a liquid and a gas. In the latest analysis there appears to be a threshold level for MB Temp, at about 111 [1], above which the daily infection rate begins to decline.
Mask wearing and other measures, such a social distancing, together limit the ability of the coronavirus to propagate. Finding new hosts to infect enables the virus population as a whole to cool down, like the molecules of a gas expanding into an empty space. This is what the US needs to do to raise MB Temp above, and to stay above, the dashed threshold to reduce viral propagation.
The analysis shows that this works. Take the case of the UK pictured below, for example.

The dashed line gives the level above which MB Temp values are associated with a declining number of daily viral infections
Quite recently the UK experienced an alarming rise in the number of coronavirus infections, following the summer months where the epidemic appeared to be under control. This second wave now appears to be attenuated through a range of restrictions and confinement measures that have been assembled simply to limit opportunities for the virus to propagate. MB Temp has passed through the important threshold.
Precisely the same points can be made regarding the R0 reproduction number. It is likely that this correlates with MB Temp which is derived through a different analysis of the same data. The merits of the thermodynamic analysis used here remain to be determined, but may well reside in how the physics may help explain the epidemiology.
The picture presented for the UK above is also visible in analyses for France and Germany, which will be presented in a subsequent article in this series. All three countries have successfully initiated a decline of the dangerous second wave of SARS-CoV-2 infections, and the healthcare consequences of the Covid-19 disease. These outcomes remain tentative and dependent on not relaxing personal behaviours to ensure that MB Temp does not fall.
These European nations show what can be done and what needs to be done for the US to regain control over its potentially catastrophic situation.
Vaccines are providing a light at the end of the tunnel, but the world will remain in the tunnel for at least another six months and, today, the situation in the US is approaching critical. Yet the most recent analysis shown above does point to a rising MB Temp and, with a more concerted effort, the inversion of the infection growth curve is realisable.
Notes
[1] MB Temp is estimated from the best fit of a simulated epidemic to infection data at different cycle times. This temperature is not recorded in units of Centigrade or Fahrenheit as it specifies a Maxwell-Boltzmann statistical distribution for the energy in the virus as if the virus were moving through society in a manner analogous to the movement of gas molecules in a container. As such, it is proportional to the square root of the temperature measured on an absolute scale.
For related articles on Chief-Exec.com : Click Here

Headline Photo Credit: Corona Borealis Studio/Shutterstock.com
Data sources for the number of SARS-CoV-2 infections are:-
European Centre for Disease Prevention and Control (ECDC)
Johns Hopkins University
This data is retrieved from OurWorldInData.org.