The coronavirus epidemic has erupted in India in the form of a single wave that has stretched out for almost a year. The US, UK and Ireland all show tentative signs of improvement from dire scenarios. Meanwhile, for some mainland European nations, where infection rates have stabilised, there is a sense that more needs to be done to avoid health systems being overwhelmed.
This update follows on from that published on January 18. This earlier article includes a summary of how to interpret the charts.
Featuring India

The dashed line gives the level above which MB Temp values are associated with a declining number of daily viral infections
Compare the above chart with those of any other country and you will see that India is indeed incredible.
For India, the coronavirus epidemic has appeared as a single huge wave, with numbers of confirmed cases reaching up to 100,000 per day in the middle of 2020, according to Our World in Data.
This behaviour corresponds to a slow elevation of the value of MB Temp that has endured throughout the epidemic, after a brief initial flourish in a Phase I mode. This rising trend is characteristic of the huge momentum conferred upon India by the mass of its large population of 1.4 billion people and probably also their diversity. If India were a ship, it would be a supertanker.
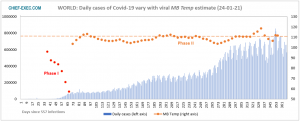
Yet the steadily rising value of MB Temp also indicates a sense of purpose and national intent. If this were not the case, then MB Temp would resemble the pattern exhibited by the entire world, shown below, with a value that is flat and sitting generally just below the 111 value that forms a threshold above which the coronavirus is too “hot” to be able to harvest the energy it needs to replicate and propagate.
Compare this pattern of infections in India with those of much smaller nations such as Ireland (5 million) and Israel (9 million). A sense of momentum disappears as one can observe rapid changes of direction and responsiveness to measures (or lack thereof) used to limit the level of social interaction.
 They may be acting slowly, but the confinement measures taken by India have been substantial and generally more stringent than those deployed in the UK, as shown here using the Oxford COVID-19 Government Response Tracker.
The relentless rise of MB Temp in India and the long tenure of its position above the 111 threshold have led to a falling daily count of confirmed coronavirus cases over the last 125 days. It has now dropped to about 14,000 cases per day – less than France, Italy and Germany.
The relative success of the measures taken by India to control the SARS-CoV-2 epidemic does have a negative consequence in that there is less motivation for the Indian population to seek to be vaccinated against a background of safety fears and spread of misinformation about the vaccine. This is despite the country being home to the Serum Institute of India – the world’s largest vaccine manufacturer.
France
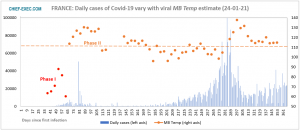
France continues with its MB Temp estimate resting in close proximity to the 111 threshold. Despite this condition for relative stability in the number of daily infections, over the past 60 days this number has slowly drifted higher. This modest expansion appears proportionate to an increase in a characteristic Cluster Size, which we can also estimate for the country.
The extension by two hours of a national curfew, to begin at 6pm, seems to have had a limited effect and now attention has turned to whether the French government will resort to a third national lockdown. While infection growth is currently subdued, one eye is watching what is happening in the UK and how such a fate might be in store for France without an early intervention. After all, 8 per cent of France’s coronavirus infections are now due to the “variant anglais”. The nation should know its fate by the weekend.
Germany
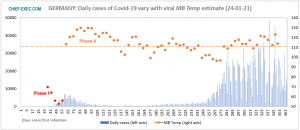
As with France, Germany also continues to hold a relatively stable level of daily confirmed Covid-19 infections.
Indeed, for Germany the relatively higher values of MB Temp infer a gradual decline in the number of infections. These are now at about 15,000 per day, but even at this level, over a sustained period, hospitalisations can build up and risk overwhelming the national health system. For this reason, the German national lockdown is likely to remain in place.
Ireland
The latest analysis of the infection data in Ireland has detected some sign of improvement from a dire recent scenario.
The deleterious situation that has prevailed appears to have been turned round with a rapid phase transition to the more stable Phase II behaviour, together with an MB Temp estimate that is above the 111 threshold. If this behaviour can be sustained, then control of the coronavirus epidemic in Ireland should be restored.
Israel
The situation in Israel was featured in last week’s article in the Chief-Exec.com Covid-19 series.
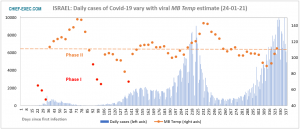
The previously identified increase in the MB Temp estimate has now carried this above the 111 threshold level, indicating that the third wave of the coronavirus epidemic in Israel is on its way to being contained.
Italy
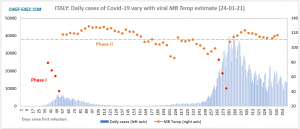
As with Germany and France, MB Temp estimates for Italy remain close to the 111 threshold and, as a result, the level of daily confirmed cases of Covid-19 remains on the previously established plateau. Being slightly higher than its European neighbours suggests a tendency for the number of confirmed daily infections to diminish, although this very tentative trend may easily reverse.
Japan
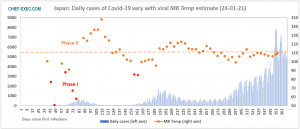
The stable behaviour of MB Temp identified earlier continues, as does the relatively stable number of daily confirmed cases, which remains at low levels compared to European nations.
United Kingdom
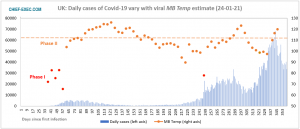
An earlier article in this series revealed that an initial MB Temp estimate signalled a suppression of the highly damaging third epidemic wave that had gripped the nation. Now, two further data points have reinforced this conclusion.
With the UK now entering its fourth week of national lockdown, this provides further evidence that the confinement measures are sufficient to regain control of the coronavirus epidemic. It should take at least a further two weeks for this improvement to reach and relieve the health services from their excessive current demand.
United States
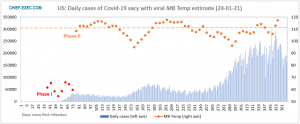
A glimmer of hope is again perceptible in the latest Covid-19 infection numbers from the US. With the latest MB Temp estimate exceeding the 111 threshold by six points, it signals a modest improvement, but also it reaches a level that has not been attained for 150 days.
It is certainly the case that one swallow does not make a summer, but if this trend can be confirmed over the coming weeks, an improving healthcare situation should accompany the arrival of President Joe Biden in the White House.
The World
As reported previously, the stable position of the global MB Temp estimate has been restored to its long-standing level around the 111 threshold.
In fact, this exceptional stability compared to the oscillating pattern for different nations indicates that, if the coronavirus is considered as a single, albeit highly-distributed organism that is infecting the world, then this organism appears to have changed little since the beginning of the global pandemic.
The next update will be published on Monday 1 February, 2021.
For related articles on Chief-Exec.com : Click Here

Headline Photo Credit: Manoej Paateel/Shutterstock.com
Data sources for the number of SARS-CoV-2 infections are:-
European Centre for Disease Prevention and Control (ECDC)
Johns Hopkins University
This data is retrieved from OurWorldInData.org.

