A background to this update can be found in an introductory article to the Chief-Exec.com Covid Analytics platform. This update follows on from that published on January 6.
Featuring Italy

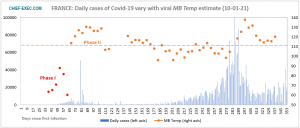
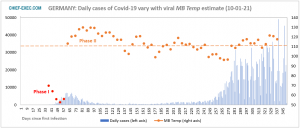
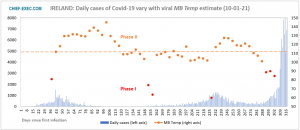
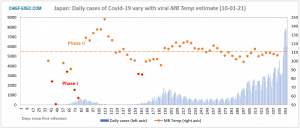
The dashed line gives the level above which MB Temp values are associated with a declining number of daily viral infections
Italy was the first European country to face the hugely challenging healthcare consequences of the SARS-CoV-2 epidemic. It served as a stark warning to the rest of the continent.
Looking back to the spring, the first wave of infections looks diminutive to what was to follow later in 2020. However, the epidemic was concentrated largely in the north of Italy, notably in the province of Bergamo. Healthcare resources were rapidly overwhelmed leading to one of the deadliest Covid-19 outbreaks the world has experienced.
The Italian government introduced a strict lockdown in affected regions on March 9, leading to a peak of the first wave in the middle of that month. As we have charted for other nations, this initial suppression of the first wave of the epidemic was marked in Italy by a strikingly rapid elevation of MB Temp – a parameter we are able to estimate from the pattern of infections in the country over time. Above a threshold level of about 111, it appears that the coronavirus was less able to propagate through the Italian population.
Following the first wave, restrictions to social interaction kept the MB Temp above this threshold, shown as the dashed line, for 110 consecutive days during which number of infections were reduced to about 200 cases per day, as opposed to 6,000 at the peak of the first wave. This discipline and duration to control the virus was proportionate to the trauma experienced in the north of Italy.
The emergence of a second wave coincided finally with MB Temp falling below 111. We speculate that this leads to the thermodynamic conditions necessary for the coronavirus to draw the energy from the hosts it infects, to power its reproduction and propagation.
Another aspect of this thermodynamic perspective is a phase transition which, for Italy, appears twice at times when an exponential growth of infections was under way. As in the first wave, this problematic Phase I transition is seen to be rapidly reversible by the confinement measures that were introduced.
The latest data shows that MB Temp has been successfully held above the 111 level now for 50 consecutive days, albeit remaining rather close to this threshold. This has coincided with a managed level of infections that have stabilised at about 18,200 infections per day.
France
The similarity between the patterns of infections between France and Italy throughout 2020 is striking. The number of daily infections at the peak of the second wave in France was almost double that observed in Italy, perhaps associated with the longer interval of relaxation over the summer months, during which MB Temp largely sat below 111. The response in France was proportionately more effective in terms of MB Temp elevation to bring about a stabilisation of the daily infection rate at about 13,300.
Since 15 December, France has opted for a national curfew that remains in place to the present day. Originally set between 20:00 and 06:00 hours, the starting time has been brought forward to 18:00 in departments where infection rates are rising and stretching the available healthcare resources.
When to open the cafes, cinemas, theatres and sports centres is a matter of much debate, in particular in relation to the winter holiday season. The snow is falling and the call of the mountains is strong.
Germany
As with Italy and France the most recent data from Germany shows a stabilisation of infections levels, in this case at about 19,900 cases per day for the last 50 days.
The analysis indicates that the confinement measures in Germany, introduced on December 16 are starting to bear fruit, although the highly fluctuating data makes both the identification of patterns and the estimation of constitutive parameters such as MB Temp more uncertain and error prone.
Ireland
The analysis of the Covid-19 epidemic in Ireland is revealing a serious degradation. The confinement measures introduced at the beginning of 2021 have yet to show any effect on the growth of infections.
Whereas Italy, France and Germany are seeing infection rates stabilise at between 10,000 and 20,000 cases per day, no such control is yet apparent in the data from Ireland and the United Kingdom. It is possible that this common Anglo-Irish behaviour may be indicative of the impact of the new English variant of the coronavirus for which increased transmissibility could well promote a rapidly falling MB Temp.
In Ireland the MB Temp parameter has also registered a phase transition that is indicative of the conditions for a high rate of growth in infections. It is analogous to a fire with simultaneous small outbreaks that flare up rapidly, rather than a larger single combustion.
Japan
The situation in Japan is featured in last week’s publication. MB Temp values have continued stubbornly to avoid upward passage through the 111 threshold that could herald less infections. As a consequence, the most recent infection data is showing a rapid rise in cases. Japan’s Prime Minister, Yoshihide Suga, announced on January 7 that Tokyo and three nearby areas would be closed down until February 7.
United Kingdom
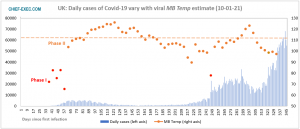
The most recent infection data from the UK does not paint a pretty picture.
As in Ireland, MB Temp values have fallen to abnormally low levels and infection rates are rising, with over half a million cases of Covid-19 recorded in the UK in the last 10 days, without any sign of respite.
United States
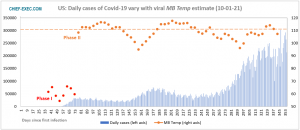
The possibility that the United States may have reached a turning point (alluded to in earlier analyses) seems to have been extinguished by recent infection data, which shows the reversal of the short-lived excursion of MB Temp above the dashed threshold. A further rise in infections rates is to be expected.
In this year to date, 26,649 people have died from Covid-19 in the United States. It is January 11.
The World
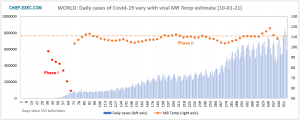
Today, the 90 millionth person infected by Covid-19 was recorded on the Johns Hopkins University database from which Chief-Exec.com derives its data.
The stable position of the global MB Temp estimate has been restored to its long-standing level after a short sojourn north of the 111 threshold.
The next update will be published on Monday 18 January 2021.
For related articles on Chief-Exec.com : Click Here

Headline Photo Credit: Lightspring/Shutterstock.com
Data sources for the number of SARS-CoV-2 infections are:-
European Centre for Disease Prevention and Control (ECDC)
Johns Hopkins University
This data is retrieved from OurWorldInData.org.

