
A background to this update can be found in an introductory article to the Chief-Exec.com Covid Analytics platform.
Featuring Japan
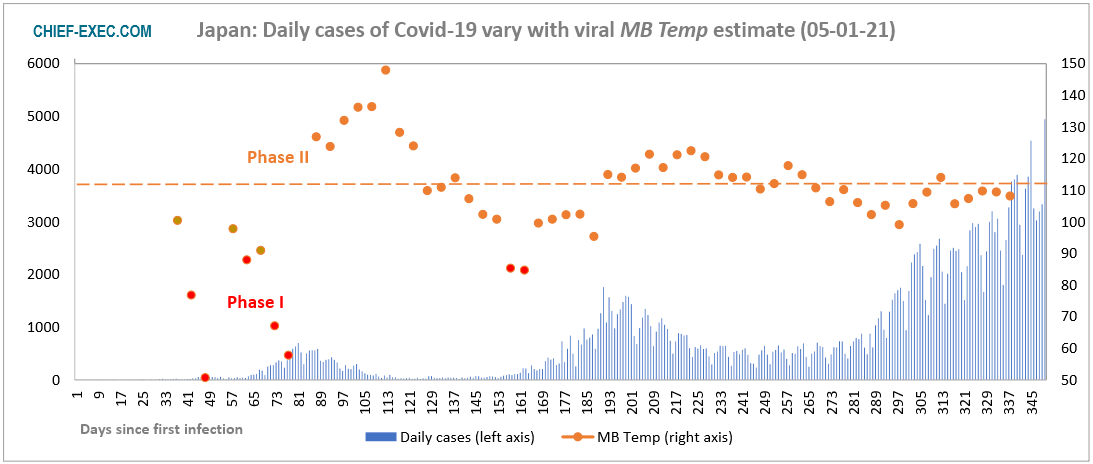
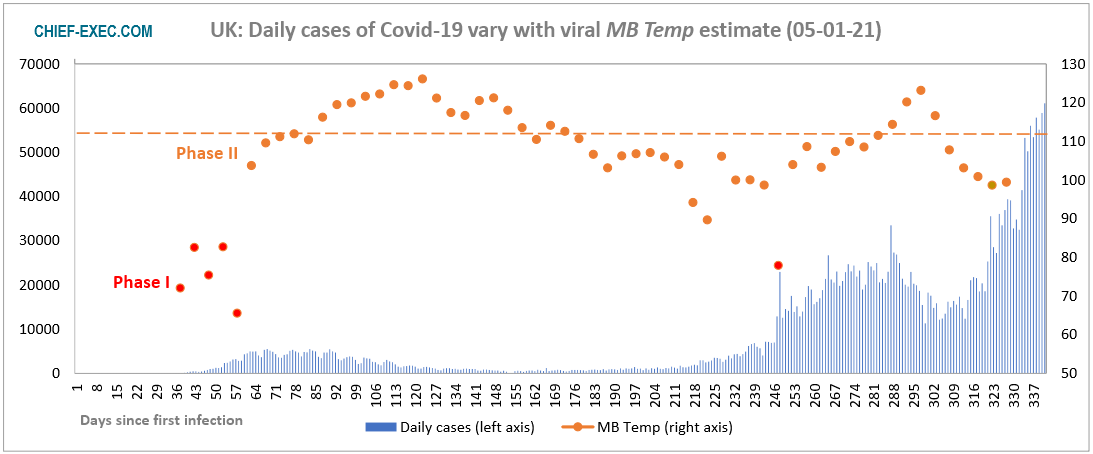
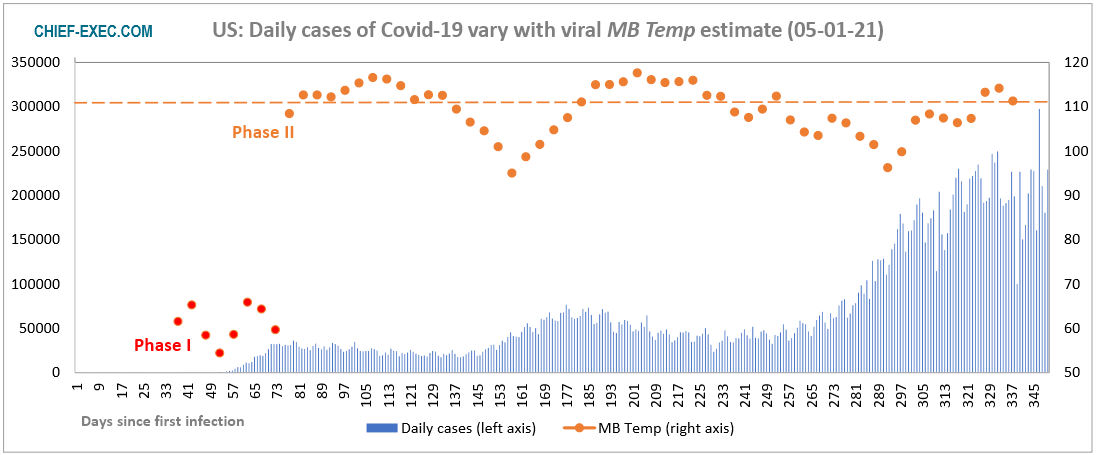
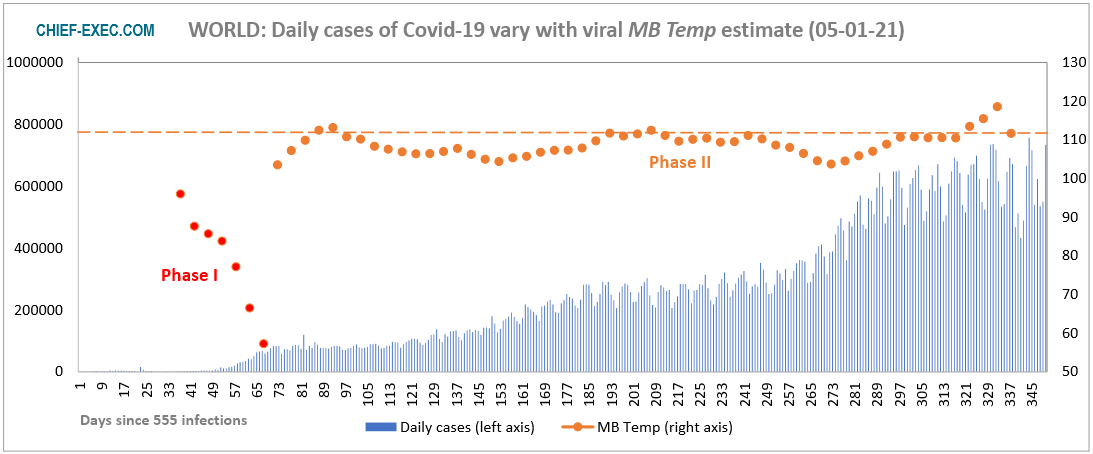
The dashed line gives the level above which MB Temp values are associated with a declining number of daily viral infections
The overall pattern of SARS-CoV-2 coronavirus infection in Japan largely follows that of other counties reported here. A small initial wave of infections was effectively supressed by measures which raised a viral temperature estimate, which we call MB Temp, well above the 111 threshold that appears as the dashed line in the above graph.
For 50 days following this first wave of coronavirus infections daily cases of infection practically disappeared, suggesting that the pandemic was under control, but throughout this period of calm MB Temp continued to fall to a point at which a second epidemic wave was initiated, with a previously observed phase-shift possibly setting the conditions for an episode of exponential growth.
As with most of the countries shown below, changes of MB Temp are inversely related to the changes in daily infections, with 111 appearing as a threshold at which infection levels stabilise and above which infections fall. Most recently, over the past 70 days in Japan, MB Temp estimates have been almost entirely less than 111, cumulatively resulting in a gradual growth of infections, which nevertheless remain at relatively low rates compared to other parts of the world.
Japan to declare virus state of emergency in Tokyo region.
But the new month-long restrictions coming into force today will be far less strict than lockdowns in other parts of the world and softer than Japan’s first state of emergency last springhttps://t.co/MdP6XKHTfJ pic.twitter.com/TWS19MusV2
— AFP News Agency (@AFP) January 7, 2021
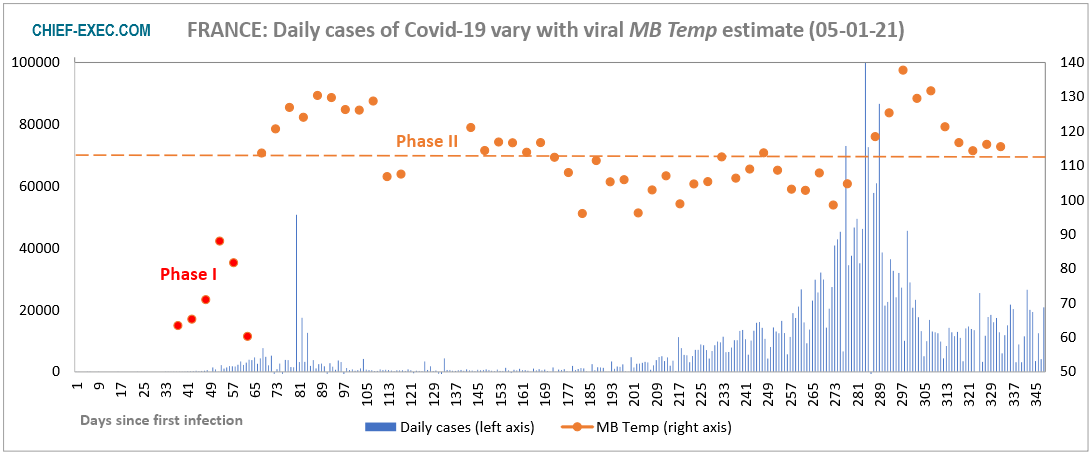
France
Click graphic to enlarge, back button to return
In early May last year, the then French Prime Minister Édouard Philippe explained his difficulty in relaxing the constraints of France’s first national lockdown. “Too much relaxation and carelessness, and it’s a second wave looming; too much immobility and anxiety, and it’s collective suffocation. This is the mountain ridge along which we must advance: on each side there is a vertiginous drop”.
After too much relaxation over the summer and following the consequential vertiginous second wave, it seems France has learned to walk the ridge with a curfew of varying proportions depending on the severity of the Covid burden across different regions. France’s daily rate of infections has stabilised at about 14,000 cases per day over the past 50 days. Most shops are open, but cafes, restaurants, theatres and sports centres remain closed. Nevertheless, the situation remains precarious.
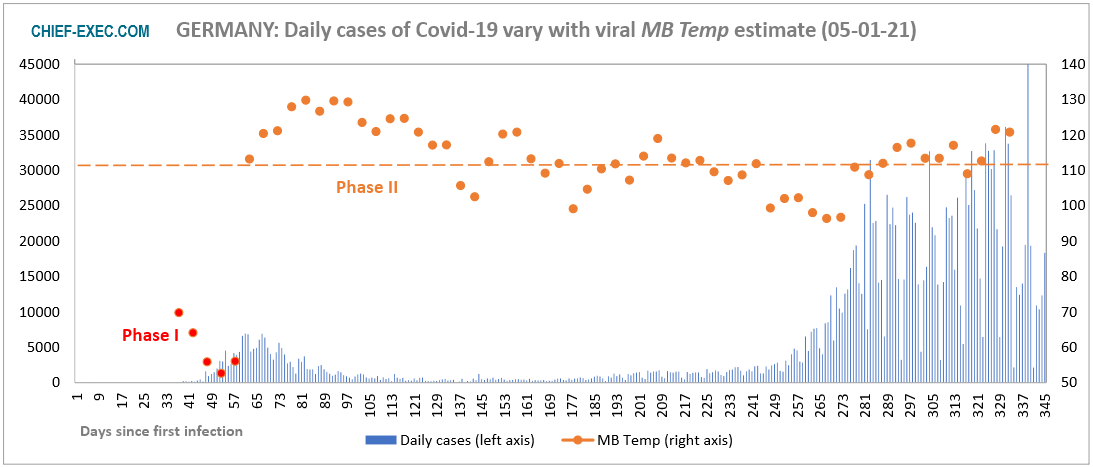
Germany
Click graphic to enlarge, back button to return
Like France, Germany’s second wave of Covid-19 occurred with a fall in MB Temp below a threshold level of 111, shown as the dashed line in the graphic. Unlike France, the preferred lockdown measures did not greatly elevate MB Temp above this threshold and the suppression of the second wave was very equivocal. Recently, tighter national lockdown measures seem to be bearing fruit.
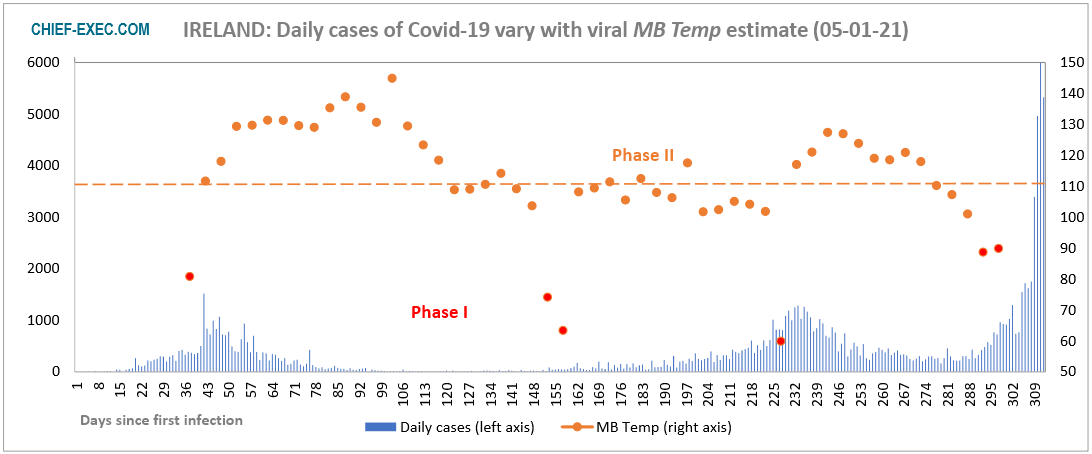
Ireland
Click graphic to enlarge, back button to return
Having well-manged Ireland through two waves of the Covid-19 epidemic, the country was still vulnerable to a vertiginous third wave which is currently ongoing and dwarfs its two predecessors. Falling MB Temp values appear to have initiated a phase change which has been associated with all early episodes of exponential growth as SARS-CoV-2 virus initially took hold across the world.
New stringent national lockdown measures were introduced at the end of 2020. These have yet to show their impact on the alarming growth of Covd-19 infections in Ireland, which may in part be exacerbated by the prevalence of a new UK variant of the coronavirus.
United Kingdom
Click graphic to enlarge, back button to return
The recent situation in the UK follows the same pattern as that seen in Ireland and the same association has been made with the new variant of the virus which appears to have a transmissibility enhanced by about 70 per cent. The second wave was hardly suppressed by a weak national lockdown followed by a tier system that limits the degree and types of social interaction depending on the levels of infection in different regions.
This week, with the UK National Health Service under severe pressure, a new tighter national lockdown was urgently implemented. This is expected to last at least until March, subject to interim review.
United States
Click graphic to enlarge, back button to return
The United States continues to break records for its political neglect of the coronavirus epidemic, with exceptionally high levels of infection that have taken healthcare services to the brink of collapse.
However, there is a glimmer of hope in our latest analysis. Recently, MB Temp values have been climbing, which has led to a turning point in an estimated Characteristic Cluster Size for the country – that previously had been on a monotonic rise from 899 to 5,337 over 70 days, At the last data-point this parameter fell to 4,791. This sets the scene for a falling rate of infection if the behaviour of American citizens can sustain the national MB Temp above 111 for a long enough period of time for the virtuous circle of a decline in infections to take hold.
The World
Click graphic to enlarge, back button to return
Alas, for the entire world a similar glimmer of hope, with the very stable MB Temp drifting above the 111 threshold for the first time since the beginning of the pandemic, has been dimmed. The very last data point seems to mark a sharp return to business as usual for the SARS-CoV-2 virus on a global scale – unless this single data point is itself anomalous.
The next update will be published on 11 January 2021.
For related articles on Chief-Exec.com : Click Here

Headline Photo Credit: Lightspring/Shutterstock.com
Data sources for the number of SARS-CoV-2 infections are:-
European Centre for Disease Prevention and Control (ECDC)
Johns Hopkins University
This data is retrieved from OurWorldInData.org.


