
There are early signs to suggest that a coronavirus and a steam engine have enough in common to provide a useful perspective for our economic well-being, writes Dr John Egan in part five of our series on Covid-19.
What if the coronavirus pandemic can be seen as a liquid or a gas flowing around the world infecting its regions? Measures to control its spread could then be seen as a way to direct the flow or to seal vulnerable places against contamination.
Chief-exec.com analysis of the patterns of viral infection suggest this as an intriguing possibility.
Let us start with a question. Is the SARS-CoV-2 coronavirus that causes the disease Covid-19 alive? The answer is yes and no. It depends on how one defines life.
Earlier, in this journal’s Encipia section, a living entity was presented as a schizophrenic mix of two identities: the artist and the photocopier. The former creates new information, which the latter may then replicate.
From this perspective, SARS-CoV-2 is most definitely alive. In fact, this coronavirus is actually a combination of 4 per cent artist and 96 per cent photocopier.
According to the Pasteur Institute in Paris, a virus that is 96 per cent genetically identical to SARS-CoV-2, has been identified in bats captured in China. The bat is therefore most likely the origin of a virus in which 4 per cent of its genetic code has modified through mutation, possibly in an intermediate mammal such as the scaly anteater, to become highly contagious in humans.
The resulting SARS-CoV-2 virus is believed to have emerged in December 2019 in the Chinese province of Hubei and on January 9, 2020, the Chinese health authorities and the World Health Organization (WHO) officially announced its discovery. By March 8, 2020, more than 100 counties had recorded cases of Covid-19.
The virus … would be dead except for its special ability to hitch a ride on a host species, and it is in this way that epidemics have spread for millennia.
The coronavirus has entered a multinational ecosystem through which information is already flowing between producers and consumers, through their enterprises and their societies. Actions to limit the propagation of the coronavirus through the replication of its genetic information also limit the commercial interactions and information that flow in an economy. The challenge is how to control the former without adversely affecting economic well-being.
Just like the flow of water in a river, there are valleys or conduits that direct the flow of information and in this respect the propagation of a virus is a special case. It has no such energy gradients to direct its flow. It would be dead except for its special ability to hitch a ride on a host species, and it is in this way that epidemics have spread for millennia.
There is nothing exceptional about SARS-CoV-2, except that it has appeared at an exceptional time when global networks of commerce have provided the means for it to flow with a rapidity that is unprecedented.
In the middle ages, it took 17 years, from 1330, for the bacterial Black Death plague to travel from China to Marseilles as a stowaway along the trade routes, before reaching England two years later.
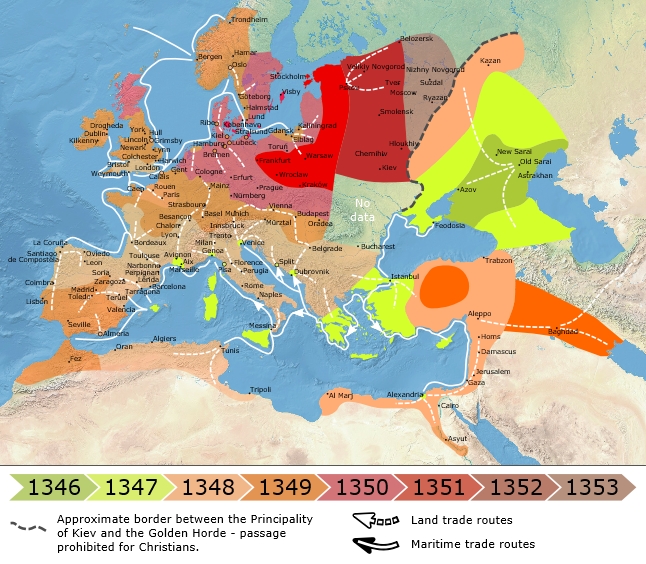
The products passing along trade routes are the carriers of the information that communicates their value. It is information created by their artist-innovators and replicated by their producers. These commercial conduits also allowed the simultaneous flow of genetic information in the propagation of the epidemic between traders and consumers.
There are gate-keepers along the trade routes. They authorise transactions to occur where perceived value of the traded goods (or labour) exceeds the price that is paid. In doing so they behave as a “Maxwell’s Demon”. This product of a 19th century thought experiment provides a thermodynamic motive force – the steam-engine equivalent that provides an energy gradient for the flow of information. For an enterprise or a household, the demon selects whatever resources are needed to make them economically “hotter” than their outside world – to give them a thermodynamic “edge” that will allow them to thrive.
Synchronised with these standard commercial interactions, the SARS-CoV-2 virus holds a biological key to enter (through an ACE2 receptor) the system and deposit its own genetic RNA information. There it can rely upon an infected cell’s own machinery and energy to replicate itself.
The Maxwell’s Demon that normally selects the information according to its value has been fooled by the virus to import information that has no apparent value and which actually could be harmful to those infected – although it should be of no benefit for a virus to damage a host that is providing such a valuable reproductive service for free.
This approach enables us to consider the mechanics of a viral infection just as we have considered an enterprise and national economies as physical systems analogous to the stretching of a rubber band [1].
The conversion requires translating the physical energetic concepts into something relevant to a viral epidemic: –
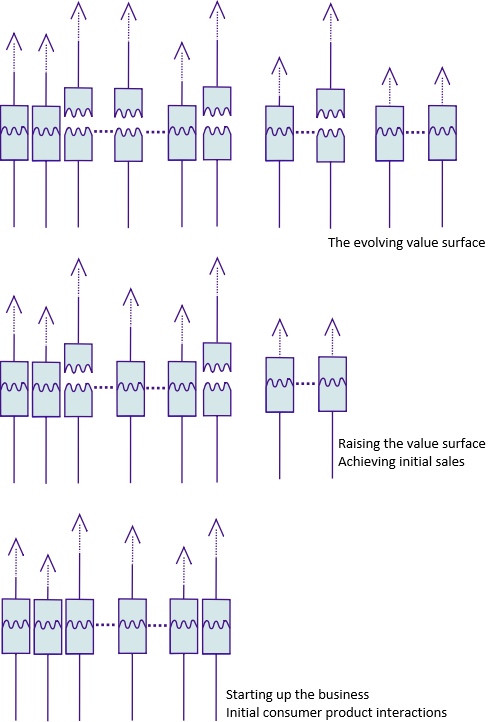
- The constitutive microfracture episodes that enact the mechanical energy dissipation in a physical viscoelastic material, and which are shown here as sale-events for a simulated enterprise, each represent an infection episode.
- The applied energy deforming the material, which is the investment in the economic domain, is associated with the number of infected cases. [2]
- Each infection episode (fundamental unit failure) is accompanied by the recruitment of a variable number of qs new units that add to a non-infected population for future infection.
A computer algorithm that encodes the above behaviour runs a repetitive incremental sequence of infection > new uninfected recruitment > further infection, as described previously for an energy dissipative enterprise.
Using a COVID-19 dataset, the infection of the entire world has been simulated from January 1, 2020 until May 29, 2020 – that is, over an initial 150 days.
The findings have been illuminating.
The global infection of the SARS-CoV-2 coronavirus is defined by a single number – 91.2.
Some previously used probability distributions that describe the micro-failure behaviour – notably the Gaussian bell-curve – appear to fit the infection data reasonably well. However, one such distribution, the Maxwell–Boltzmann probability distribution, fits the real-world data with a very high degree of accuracy and consistency [3].
Using the Maxwell–Boltzmann probability distribution, the best fit of the simulation to the global pattern of SARS-CoV-2 infection shown below is achieved with a value of recruitment parameter qs that is equal, or very close, to 1. This appears as an enduring feature which does not apply where national infection data is used – this difference will be reported on later
Furthermore, the vast majority of recruited units experience an infection event (fundamental unit failure) during the time increment directly following their recruitment. The very small number that survive from one increment into the next remain equal to their initial number set when the simulation was started.[4]
The simulated global infection of the SARS-CoV-2 coronavirus is thus defined by a single number – 91.2, which is the scale parameter that specifies the Maxwell–Boltzmann probability distribution, together with the cyclical period of the computer simulation which depends on an at-risk population size that is simulated [5].
Taken together these observations suggest that the SARS-CoV-2 coronavirus spreads not as the mechanical extension of the rubber band discussed above, which is a viscoelastic solid and retains some elasticity. The virus simulation is that of a viscous liquid or gas which flows as the infection propagates [6]. This conclusion is consistent with the statistical mechanical origins of the Maxwell–Boltzmann distribution.
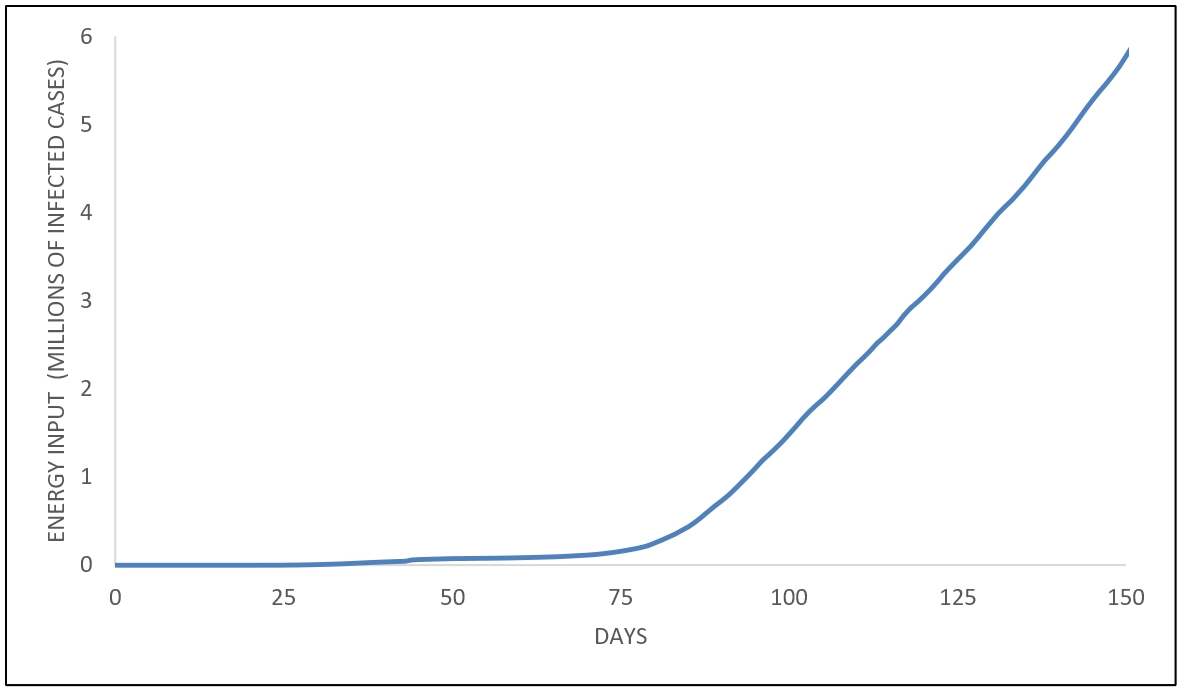 As a valley provides the energy gradients that direct the flow of its river, energy gradients can drive the information flow through the propagation of the SARS-CoV-2 coronavirus, where energy is drawn from the infected host. This is shown for the course of the 150-day simulation in the adjacent figure .
The size of the at-risk population, that is the cluster of individuals through which a local outbreak may spread, determines the cycle time of the computer simulation. This is the thermodynamic cycle through which the host energy is driving the information replication of the virus. A 50cc moped engine must run faster than a Harley-Davidson to achieve the same road speed.
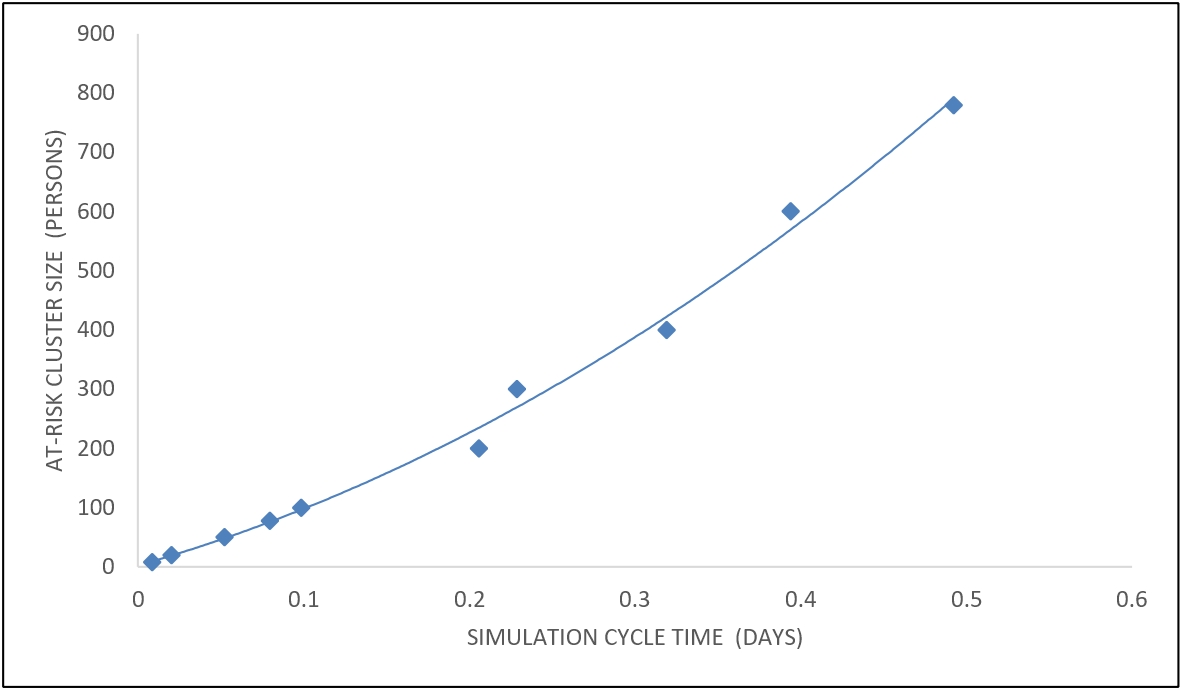 From the chart on the left it appears that an at-risk cluster of 100 people would see the viral infection cyclical period of about 0.1 days. One might imagine planet Earth, with its population of 7.8 billion, as a single at-risk organism. As such, its infection would require a thermodynamic cycle of around 21,000 years! Although caution should be exercised with any such extrapolation.
All such computer simulations are essentially windows with a view into the real world that is not directly available. Their validity must always be questioned. Here, it is felt that there are enough early signs to suggest that the thermodynamic modelling of virus transmission may offer a useful perspective.
Nations across the world are currently wrestling with the same question: how to wind-down the confinement needed to control the spread of the Covid-19 disease and allow individuals the freedom to interact, to produce and consume, for their economic well-being. These are seen as conflicting aims which need to be reconciled. In fact, they are two sides of the same coin.
WARNING: The findings reported above must be considered as tentative. The accuracy of the data used is questionable as the database certainly does not record every case of Covid-19. It is also new. Further interpretation will be presented in subsequent articles.
Notes
[1] More specifically related to the energy dissipative properties of viscoelastic materials such as a rubber band.
[2] This implies that each virus particle requires the same energy to replicate.
[3] The Root Mean Square (RMS) error of the best fit of infection simulation to the real global infection data using a Maxwell–Boltzmann distribution of fundamental unit failure is 0.115% of the total number of infections (6,245,352 cases at 150 days). For the Gaussian distribution this RMS error is 0.370% of this maximum value.
[4] This behaviour enables the total simulated force from the failed units in each increment (current and previous) to be equivalent to the total number of infections up to that point.
[5] The fact that the highly non-linear infection pattern can be simulated through a single parameter is not unexpected as this non-linearity is a feature of the real infection data input into the model, to which the model is fitted. It is the exceptional accuracy and consistency of this fit that appears to indicate the suitability of the Maxwell–Boltzmann probability distribution.
[6] There are local minima on the simulated error surface with high qs values that may indicate a solid viscoelastic behaviour is possible. However, the actual error values are higher than for the liquid/gas behaviour which is considered more realistic.
For related articles on Chief-Exec.com : Click Here

Headline Photo Credit: Moving Science/Shutterstock.com
Trade Map Graphic by By Flappiefh – Own work from: Natural Earth ; The origin and early spread of the Black Death in Italy: first evidence of plague victims from 14th-century Liguria (northern Italy) maps by O.J. Benedictow., CC BY-SA 4.0