
The UK economy appears to be venturing where no nation has gone before – at least in modern times. John Egan puts forward new analysis which shows the United Kingdom is leading the world ….. but where?
There is a way of looking into the financial world through a window that sees a national economy as an energy dissipative system.
As Chief-Exec.com reported last week, this viewpoint transplants a scientific analysis of a physical system into the economic domain – something that is not unusual. What is different are the assumptions made, and before we go any further we should issue an “assumptions warning”.
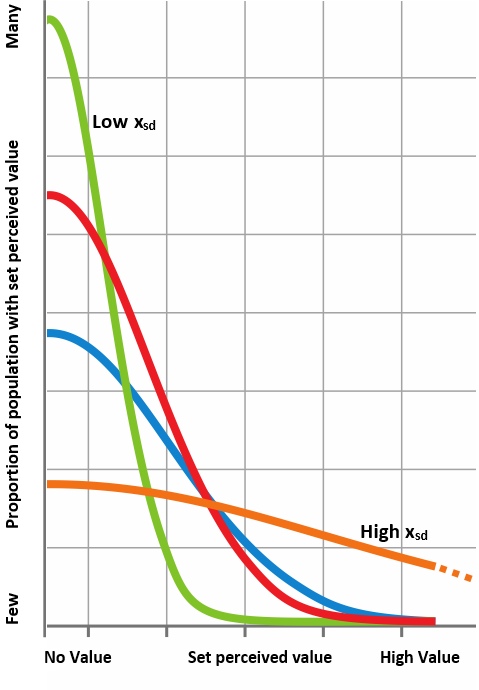 Assumption Warning: In what follows we have needed to define the marketplace for some representative traded goods. We have done this by assuming that perceptions of value across a population of consumers follow a “bell curve” Gaussian (normal) statistical distribution, with most consumers showing a negligible interest in any particular product. An increasing minority of those consumers would then associate an increasingly high value with the same goods[1].
The standard deviation of the Gaussian distribution xsd defines how divergent value perceptions are across the consumer population, with a higher xsd value indicating that more people see a high value in the product.
The findings that follow are likely to be sensitive to this assumed statistical distribution of consumer perceived value and different distributions may lead to different conclusions[2].
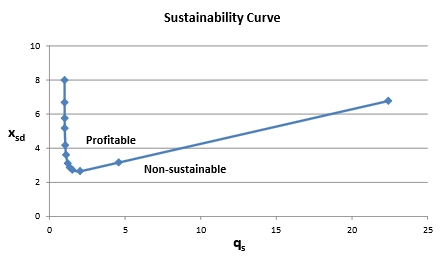
Along with xsd a second variable qs is needed to define how the event of a product sale contributes to the subsequent development of the market. It is a number that reflects the expansion of the market as more consumers begin to perceive the value of the goods in question.
With xsd and qs we can specify how an enterprise might perform – whether it might be profitable or loss-making. And between profit and loss there is a special state when the enterprise is perfectly sustainable. A plot of values for xsd and qs for which an enterprise is sustainable gives us a “sustainability curve”.
 Now national economies, ideally, should operate on the sustainability curve with a zero balance of trade. We can estimate values of xsd and qs for a real national economy to compare their behaviour with this ideal. Between 1975 and 2015, the UK economy can be seen to trace a path just below the left-hand edge of the “hockey stick” sustainability curve.
In order to understand what this means we revisit the same UK economic behaviour along the sustainability curve, together with that of four other advanced economies between 1975 and 2015, using the same methods. This comparison is shown in the chart below.
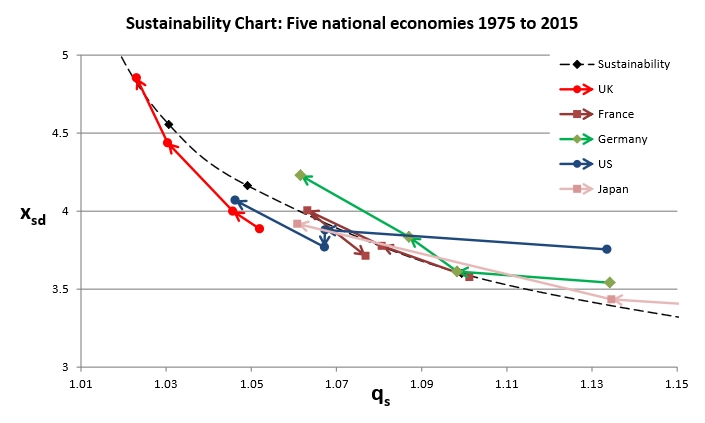
The four markers in sequence show the xsd and qs values that enable the energy dissipative economy model to provide a best fit to national GDP data from 1975-85, 1985-95, 1995-2005 and 2005-15 in sequence. Data from Japan is shown only for the last two points of this sequence, with the first two off the scale of the chart.
It appears that the four other nations are chasing the UK up the left hand side of the sustainability curve, but the UK retains a 20-year lead. The direction is not inevitable, however, with the US economy pausing for breath between 1990-2000, and most recently France putting the engine in reverse. The German balance of trade surplus is clearly visible above the sustainability curve, as is the recent deficit of the US below.
To interpret where the economic journey of most of the five nations is bound it is necessary to attribute some meaning to the xsd and qs parameters. What do they say about the real world? This must be highly tentative.
The qs parameter values can most easily be deciphered by their association with the proportion of Gross Capital Formation (GCF), as a component of the Gross Domestic Product (GDP) calculation. The lower the proportion of GCF in GDP, the lower is the qs value[3].
It remains to unravel how low qs values that indicate a low market expansion of the representative product through sale events could be influenced by GCF. However, with the position of these economies in relation to the sustainability curve, an increase in capital formation with a correlated increase in qs would move an economy (and an enterprise) to cross the sustainability curve into the profitable region.
Perhaps this observation of rises in capital formation leading to healthy economic performance may have been recognised by J M Keynes and F D Roosevelt in the 1930s.
The xsd parameter defines marketplace reaction to the representative product. In the language of earlier analysis in Chief-Exec.com, high values of xsd will make the value surface for the product easier to raise. It is as though the labour exerted on the creation of value through innovation is made more efficient as the forces resisting the elevation of the value surface are reduced.
The xsd parameter embeds market demand into the energy dissipative economic model, and it registers the impact of innovation to raise perceptions of value in a consumer population. However, the effect of innovation is to flatten and widen the (Gaussian) spread of value perceptions. It is not a shared appreciation of increased value, but an increasing individualisation and a societal division into niches to accommodate the widened perceptions of value.
The physics of the adopted energy dissipative system places an extra constraint on the evolution of a national economy by fixing the relationship between xsd and qs in order to meet the requirements for sustainability.
The particular geometry of the sustainability curve demands that as xsd increases national qs value must fall – and vice-versa – to restore a sustainable behaviour. The question of which is the driver of this change and which is the response is yet to be addressed. Nevertheless, the trend appears to be that, over the most recent decades, a reduction of capital formation and an increase in innovation is leading to a wider individualisation in advanced economic societies, possibly with a consequent fall in the collective appreciation of the value of communal assets.
And, unless the trend can be reversed, the sustainability curve in the future is only going to get steeper.
Notes
[1] The reasons for using this half-Gaussian statistical distribution are set out in Work as a vector – in a tale of two carbons.
[2] Empirical data on statistical distributions of consumer perceptions of value for real products would be helpful here.
[3] In the article On sustainability and profit it is shown that qs is unrelated to profit and it sets the fraction of the original investment that is retained at any time in the elevated value surface.
Follow on twitter: @johnmegan