
At the heart of a modern economy there beats a pacemaker with a rhythm that in large part sets its productivity, its exchange rates and the prosperity of its people. John Egan looks into this cardiac system.
 At Chief-Exec.com we have described an economy as being fundamentally composed of myriads of consumers interacting with a multitude of different products [1]. On those occasions when perceived value exceeds purchase price, sale events occur and with each transaction the sale price is returned to the producer.
This sequence of commercial transactions sets in motion an economy that advances incrementally, through many cycles that create internal rhythm.
We shall show that the faster an economy spins, more products are consumed at lower prices. We will introduce the notion of “consumptivity”, the demand-side twin of productivity [2]. The faster the economy spins, consumption increases and the stronger its currency becomes.
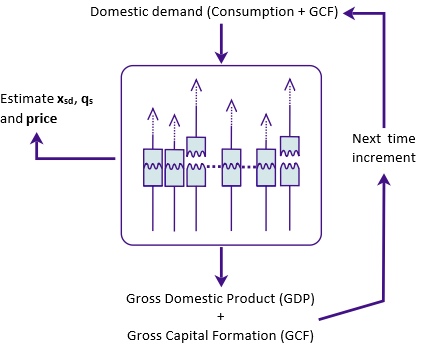
Previously, a physical analogy has been used to analyse an enterprise as an energy dissipative system. Going further, we have taken this approach up to a macroscopic level to examine a national economy. In this case, national gross domestic product (GDP) is simulated through the sales of a representative domestic product. The economies of different nations can be compared in terms of the values of two parameters xsd and qs that essentially define the market into which this representative domestic product is sold [3].
Now we turn our attention to a third quantity that completes the specification of a national economy as an energy dissipative system – the price at which the representative domestic product is sold.
Estimating the price, using the same methods previously employed to estimate xsd and qs, reveals that this depends upon the rate at which the national economy simulation, as pictured above, is cycled.
Whereas the market parameters xsd and qs are relatively insensitive to variations of the simulation time increment tr, the estimated sales price falls in an almost linear fashion as tr is shortened [4]. This behaviour is shown below for six national economies.
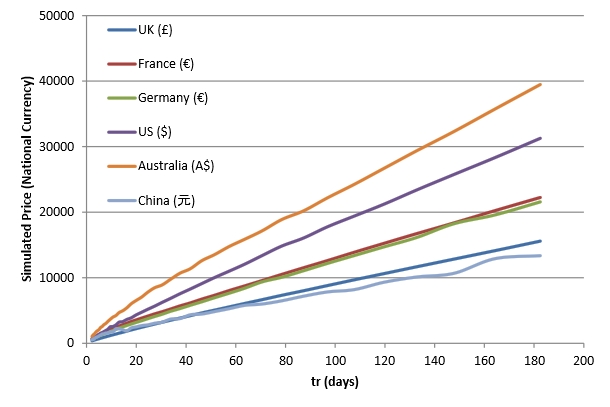
The time increment tr is the periodic cycle time taken for an economy to convert added value into product sales. The above figure shows that as tr is reduced from 0.5 years (182.5 days) to 0.01 years (3.65 days), the estimated price of the representative domestic product falls in proportion. For the UK economy, this price declines from £15,583 to £55 over this interval, so that the price:tr ratio is almost constant at £84.66 per day.
The faster the beating heart of the economy, lower prices make the products more accessible, effectively making a population of consumers more prosperous – even through GDP remains unchanged.
This decline of product price with tr brings to mind the Labour Theory of Value as proposed by the classical economists of the 19th century. According to this theory, the value of goods is proportional to the hours of human labour required for their fabrication. Here we re-interpret the value of goods to be proportional to the time it takes for those goods to be consumed. Shorter tr increments indicate a more speedy economic cycle with the creation of consumer product interactions and their conversion into product sales and revenue. We estimate that speeding up this consumption should normally reduce the price of the domestic product representing the UK economy by about £85 per day.
Individual consumers in an economy often do not see prices adjust with consumptivity increases in accordance with the Labour Theory of Value. Rather, this effect acts to increase the value of their national currency and thereby enhance prosperity. Seeing an economy as an energy dissipative system throws some light on this mechanism.
As the price:tr ratio takes into account the different national populations [5], we can say this ratio is equivalent to a Normative Price for a country’s representative product assuming a cycle time, or tr value, of one day. The Normative Price of the UK representative product is then £84.68.
Estimations of the Normative Price for seven national economies between 2005 and 2015 are shown in the table below [6], along with their ratio to the US dollar, which is serving here as the benchmark economy for comparative purposes.
| UK (£) | France (€) | Germany (€) | US ($) | Japan (¥) | Australia (A$) | China (元) | |
| Normative Price (currency) |
84.68 | 118.28 | 116.65 | 170.30 | 15880.98 | 208.90 | 69.05 |
| Country:US (currency/$) | 0.4972 | 0.6945 | 0.6850 | 1 | 93.2535 | 1.2267 | 0.4055 |
Normative Price, is the price reduction of a single sale of a nation’s representative product which is brought about by a shortening of the cyclical period of that nation’s economy by one day
Applying the underlying principle of the Labour Theory of Value, that embedded labour is the unique determinant of value in the exchange of goods, then the Normative Price should provide a measure of the value added by this labour per day [7]. If different national economies are equally consumptive, then their Normative Prices should be equivalent after adjusting for the exchange rate of the different currencies. The Country:US Normative Price ratio in the above table can therefore serve as a simulated (normative) exchange rate between each national currency and the US dollar.
If one economy were to become disproportionately more consumptive, which we interpret as a reduction of tr with a consequential fall in the Normative Price of its representative product, this would manifest itself as a comparative strengthening of the currency of that nation. GDP and domestic prices would remain unchanged, but the population would become more prosperous as a result of the enhanced purchasing power of their currency.
Real exchange rates for the six currencies relative to the US dollar can provide reference points to compare with the exchange rates predicted by the energy dissipative simulation. The highest, mean and lowest actual exchange rates for these currencies between 2005 and 2015 are shown in the table below [8].
| UK (£) | France (€) | Germany (€) | US ($) | Japan (¥) | Australia (A$) | China (元) | |
| Real currency:$ 2005-2015 High | 0.7146 | 0.8531 | 0.8531 | 1 | 123.4450 | 1.5842 | 8.2765 |
| Real currency:$ 2005-2015 Mean | 0.5986 | 0.7634 | 0.7634 | 1 | 101.1855 | 1.1651 | 7.0000 |
| Real currency:$ 2005-2015 Low | 0.4785 | 0.6271 | 0.6271 | 1 | 75.8250 | 0.9214 | 6.0489 |
Of course, real world financial markets take into consideration many factors in addition to the GDP performance on which the above simulated exchange rates entirely depend. These markets integrate predictions of interest rates, inflation, employment and various sentiment indicators that combine to form a collective view on the future prospects of a national economy.
Comparing the real and simulated exchange rates in the above tables one can note that:-
- Between 2005 and 2015 the simulated exchange rates of five national currencies compared with the US dollar sit between the real minimum and maximum exchange rates for that same period. China sits well outside of this range and in reality is a much weaker currency than is indicated by its simulated exchange value.
- Compared to the US dollar, between 2005 and 2015 the actual mean exchange rate for the UK was 17 per cent weaker than might be expected from its simulated exchange rate. It was 10 per cent weaker for Germany, 9 per cent weaker for France, 7.8 per cent weaker for Japan and 5.3 per cent stronger for Australia.
The situation of Germany and France could arise because the euro exchange rate is held lower by less productive (or consumptive) eurozone economies. In any case, for Germany, France, Japan and Australia real exchange rates are close to their simulated equivalent. For the UK the difference is larger and something that has not gone unnoticed.
For the UK an enduring “productivity gap” has characterised its comparison with other advanced economies. It is likely this is appearing in the real versus simulated comparisons here, even before the further deterioration in currency value brought about by the outcome of the Brexit referendum in June last year.
While the situation in the UK is possibly due to its productivity issues, China’s is also a matter of bringing its population into a productive capacity. As an emerging economy, China’s Renminbi real exchange rate would be typical for an advanced economy with a similar GDP and with a population of about 78 million, rather than an actual 2010 population of 1,341 million. As more of the Chinese population enters into a productive and consumptive capacity equivalent to that of an advanced economy, the divergence between the simulated exchange rates and their real equivalents should decrease.
It is reassuring that there is nothing particularly surprising about these assertions that are derived from the use of the energy dissipative system to replicate the behaviour of seven national economies. They indicate that, at a macroscopic level, the commercial transactions in a society may be viewed through the prism of a physical mechanism through which energy is dissipated through discrete micro-fracture events that are themselves analogous to the sale events in that economy.
This physical analogy has been used to analyse an enterprise as an energy dissipative system. The results here support the use of this approach and its association with the Labour Theory of Value.
Notes
[1] The fundamental unit of the economic model is the Consumer Product Interaction (CPI). These CPIs receive a share of investment and represent consequent increases of value perceptions across a population of consumers. CPIs indicate a sale event when a specific consumer valuation exceeds a set price for the product.
[2] In this article, consumptivity is used to refer to the quantity of products produced and sold in a specific time interval, rather than the conventional supply-side productivity metrics of GDP per worker or GDP per hour worked.
[3] xsd specifies the spread (standard deviation) of value perceptions across a consumer population. qs governs what happens following a product sale – notably how many other consumers as a consequence begin to appreciate the value of the goods.
[4] As the number of increments increases to span the simulation duration when time increment tr is reduced, then more sale events occur and the price estimated in order for the economic simulation to fit the known national GDP data falls by the same proportion. This is likely to be a feature of the assumed half Gaussian distribution of value perceptions across a population of consumers.
[5] This is achieved by setting the starting number of fundamental units representing the consumer product interactions to equal the national population in 2010, to provide a representative value for the 2005-2015 simulation interval. 2010 population data was taken from the UN World Population Prospects: The 2015 Revision.
[6] Australia, China, France, Germany, Japan, United Kingdom and the United States. GDP data in terms of the county’s national currency at current prices was obtained from the OECD.Stat database.
[7] The price:tr ratio estimates are presented in each national currency, as these are derived from GDP data in that currency. The 2010 population of that country is set as the initial number of consumer product interaction units for the simulation of the economy. This price:tr ratio, and therefore the Normative Price, is a measure of value exchanged per capita for each economy based on the assumption of comparable consumptivity (tr value).
[8] Source: http://fxtop.com/en/historical-exchange-rates.php
Follow on twitter: @johnmegan