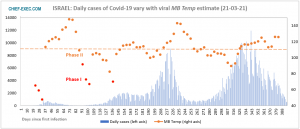
Dr John Egan poses the question: Is Israel on the verge of illustrating the impact of a successful vaccination campaign?
It is the first anniversary for many national confinements that were initially needed to control a rampant pandemic.
After 400 days of data collecting and analysis, the world has learned much about the SARS-CoV-2 virus and the Covid-19 disease it causes – its targets and treatments, its long-term consequences and its deaths. The main thing we have learned we already knew.
In a pandemic, individual actions matter but only as contributions to their population. Most misjudged moments cannot be associated with the deaths they cause a month or so later, but this line of cause and consequence still exists. Those miniscule moments are critical to how a nation has responded to the pandemic.
The second wave of the SARS-CoV-2 viral infections that we announced 10 days ago is now firmly established in #India, with an MB Temp clearly below 111 indicating that a further growth of daily cases should be expected. An accelerated vaccination campaign will be important. pic.twitter.com/1RX4lCkUta
— CovidAnalytics (@AnalyticsCovid) March 20, 2021
India, for example, has seen one enormous tsunami of infections brought under control, but now a second wave is emerging. For Ireland the story has been one of a roller-coaster of exponential growth and vertiginous drops through three waves of infection.
Now one country has broken the mould. Over the past 10 days, in contrast to the past 400 days of readings, the MB Temp value we have used to signpost the pandemic’s evolution has been pushed sharply up, at the same time as Israel is relaxing its measures of confinement and gradually returning to normal.

The dashed line gives the level above which MB Temp values are associated with a declining number of daily viral infections
Daily Covid-19 cases in Israel can be seen dropping equally sharply. The main indicators for the pandemic also appear to be easing and Israeli authorities aim to vaccinate the entire over-16 population by the end of April.
In the Chief-Exec.com analysis there appears a first visible sign that the Israeli vaccination campaign is kicking in. Today, just over 60 per cent of Israel’s population will have received at least one vaccination. A month ago, it was 50 per cent. This intervening month has given time for inoculated individuals to build up their immunity and, right on time, this effect can explain the recently elevated estimates of MB Temp.
For 400 days we have “modelled” how individual behaviours combine and how their populations behave using an analogy in thermodynamics of how individual gas particles combine to determine the properties of the gas. The goal has been to understand the energy flows involved – the energy for the replication and propagation of a virus in the pandemic is no different to that flowing through the engine in a car. It flows as heat from hot to cold.
In this analysis, the virus must keep itself cold in order to draw down the energy it needs from its warmer infected hosts. The virus has to infect new hosts in order to keep itself cold. It too behaves as a population of microscopic infections that build up to become a macroscopic epidemic.
Single episodes of mask wearing, personal separation and hygiene – combined with repeated national lockdowns and other forms of confinement – block contagion and cause the virus to heat up to a point where it becomes less efficient as the viral engine starts to seize up.
The single number MB Temp, short for Maxwell-Boltzmann temperature after the scientists who unravelled the underlying thermodynamics, can be used to signpost the direction the epidemic is taking. A value of 111 marks the point where the viral expansion goes into reverse.
Charting MB Temp over the past 400 days we have followed the highs and lows of the SARS-CoV-2 epidemic across 10 nations selected to represent the world. We have estimated MB Temp every five days and published the results through Twitter.
Over the past 10 days Israel has broken the cycle of confinements in all our representative nations up to this point. It remains to be seen if this effect is durable, but if it is, it will showcase the impact of a successful vaccination campaign.
Vaccinations are opening the route back to normal. Or at least towards a new normal, whatever that might become.
For related articles on Chief-Exec.com : Click Here


