
On this new platform we display the exclusive results of Chief-Exec.com’s analysis of Covid-19 data from around the world. A five-day publication cycle is synchronised with our analytical methods to provide a real-time view of the pandemic. We start by featuring The World along with summaries for five countries.
It has been over 300 days since the SARS-CoV-2 virus appeared in the world. By December 26 it was responsible for over 80 million Covid-19 cases globally and, of these, more than 1.75m people have died.
At Chief-Exec.com we have looked at how this virus acquires and uses the energy it needs to spread. An explanation of this background is available in earlier articles in our Covid-19 series.
In summary, we might imagine a virus is an engine that is driving the pandemic. The virus cycles through innumerable loops of infection-propagation-reinfection of a population using the energy that it is able to extract from infected individuals to fuel its reproduction.
In a car engine, the heat generated by ignition of the fuel powers the vehicle as it flows towards a cooling radiator. In this analogy our analysis is the sensor that measures the temperature of the engine – which we call MB Temp – and we can also measure its cc and rpm. We have found that above a temperature of about 111 the viral engine for SARS-CoV-2 starts to seize up [1].
Furthermore, we tentatively speculate that an uninfected population into which the virus can expand provides the car radiator affect – this is the heat sink into which the virus can cool its MB Temp. This is consistent with the known impact of confinement, effectively increasing MB Temp by blocking viral transmission.
The World in 2020
The most striking characteristic of MB Temp on a global scale over the course of 2020 has been its stability, following an early transition from a Phase I to a Phase II that has persisted for most of the year.
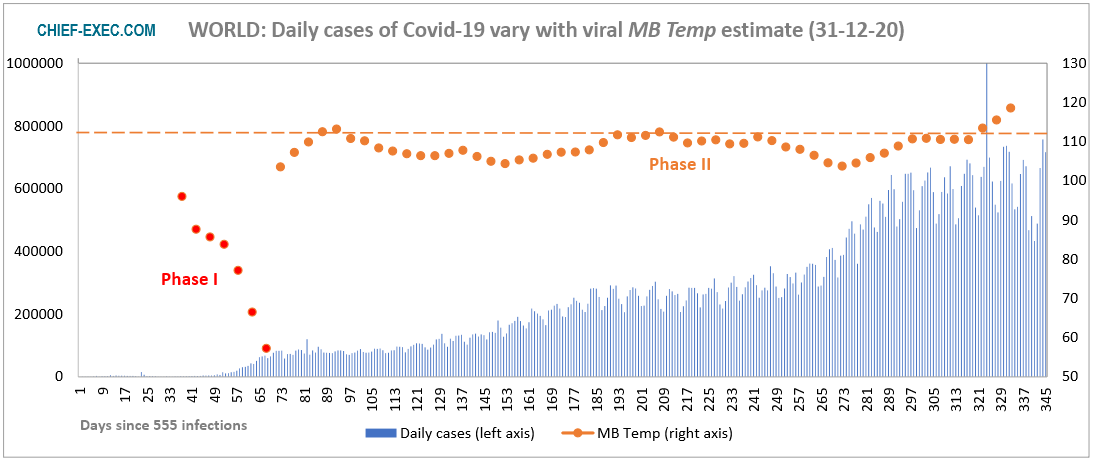
The dashed line gives the level above which MB Temp values are associated with a declining number of daily viral infections
Mostly the estimates of MB Temp sit close to the level of 111 shown as the dashed line above. On rare occasions when the dots drift up to the dashed line, the number of daily cases of Covid-19 does not increase. More often MB Temp sits below the dashed line and a steady growth in global viral propagation is recorded.
The most recent data points suggest that MB Temp may be increasing which, if the trend is confirmed, should lead to a fall in infections globally.
France
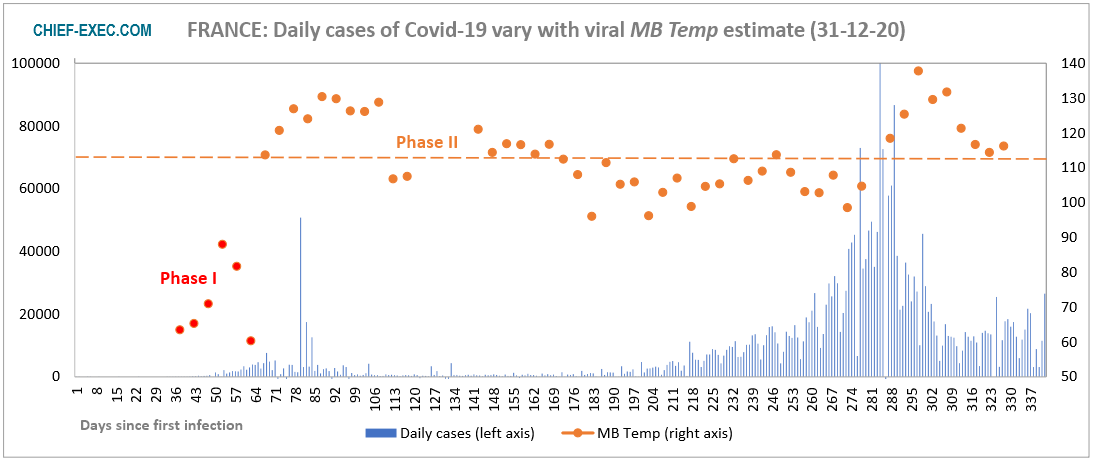
A first wave of Covid-19 cases was suppressed by a stringent confinement between March 17 and May 11, followed by a partial loosening of constraints to enable some economic activity to restart. The number of infections fell to a level low enough to judge that the epidemic was under control, until the summer months provided the opportunity for the virus to regain its hold. For 110 consecutive days MB Temp stayed at or below the 111 threshold, providing the conditions for a second wave of Covid-19 infections that was amongst the worst in Europe.
A second lockdown in October and November, followed by a national curfew between 8pm and 6am, has proved to be a particularly effective way to subdue the epidemic. “This time France did everything right and achieved impressive successes, while in Germany, unfortunately, the momentum of the second wave has still not been broken,” recognised Peter Altmaier, Germany’s Federal Minister for Economic Affairs, in early December.
Nevertheless, new cases of Covid-19 have remained stubbornly above the 5,000 per day level President Macron had set for ending the second lockdown. Recently, the relatively low and stable infection rates in France disguise large regional disparities that this week saw a two-hour extension of the national curfew in the east of France where the epidemic has once again taken hold.
Germany
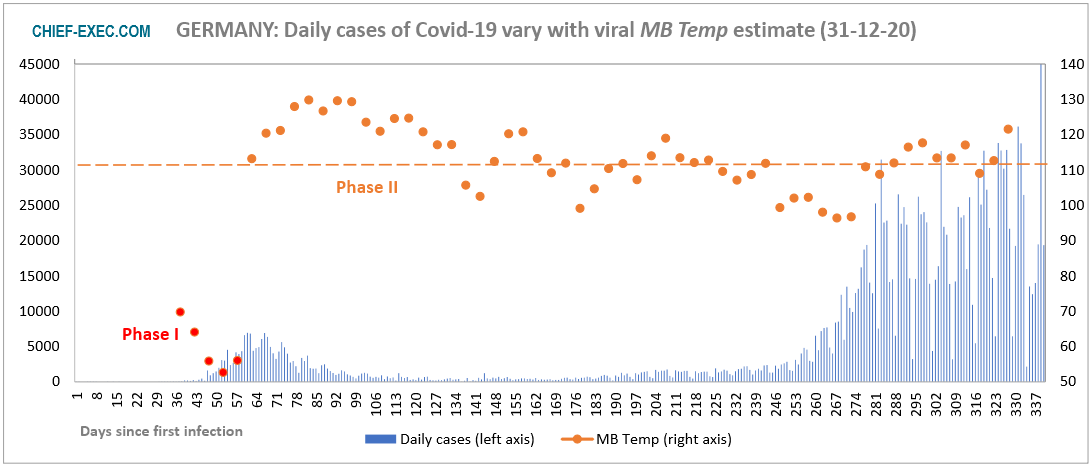
For Germany MB Temp values reflect the admirable control the country had exercised over the first nine months of 2020. The country was applauded as an example of best practice: large scale testing with effective tracing, and then acting quickly to break the chains of viral transmission. A first wave was rapidly suppressed and mortality was low. However, in the run up to Christmas with a soaring number of cases of Covid-19 it was recognised that Germany is no longer a role model.
A consecutive sequence of 30 days (6 data points) of low MB Temp values coincides with an alarming growth of infections that led to the urgent imposition of constraints. Despite these, MB Temp estimates are struggling to exceed the threshold necessary to regain control over the epidemic in Germany, with reports that a lockdown until Easter may be necessary.
Ireland
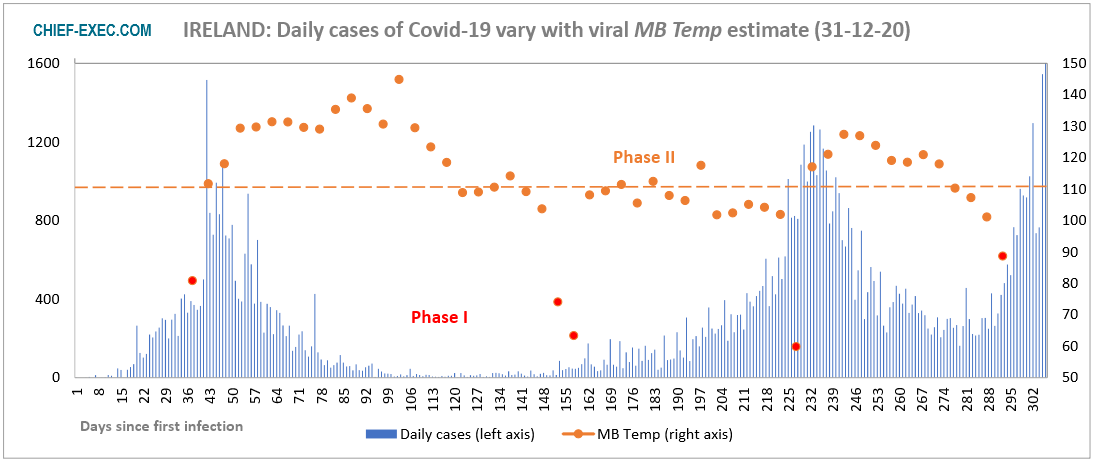
In Ireland the graphic above reveals a striking difference in the duration over which MB Temp was held at elevated levels to suppress the first wave of Covid-19 infections to very low levels. Such persistence does not appear in the response to a second wave, with a relatively rapid fall of MB Temp that is accompanied with a corresponding rebound of Covid-19 infection rates. It is noteable that the most recent data points shows a transition to a Phase I behaviour that is correlated with episodes where infections can grow at an exponential rate.
In response, and recognising that the new variant of SARS-CoV-2 that originated in the UK was now spreading rapidly through Ireland, on Wednesday Taoiseach Micheál Martin announced the return of the most stringent level 5 restrictions that would last at least until the end of January.
United Kingdom

The latest infection data from the UK indicates a deteriorating situation.
The emergence of a new wave of infections is signalled by the falling MB Temp values over the most recent 25 days. This has resulted in a significant tightening of lockdown and yesterday 44m people (78 per cent of England’s population) effectively were instructed to stay at home.
The emergence of a new strain of the coronavirus (VUI202012/01) that appears to show enhanced transmission is a source of much concern. The last 20 days on the above chart, using infection statistics up to December 31 [2], shows a steady decline in MB Temp value below the dashed threshold. This trend will have to be reversed by the new lockdown measures for these to lead to a decline in the level of daily infections.
This recent growth of Covid-19 cases in the UK is troubling, with some suggesting that existing confinement measures do not go far enough to bring the epidemic under control.
United States
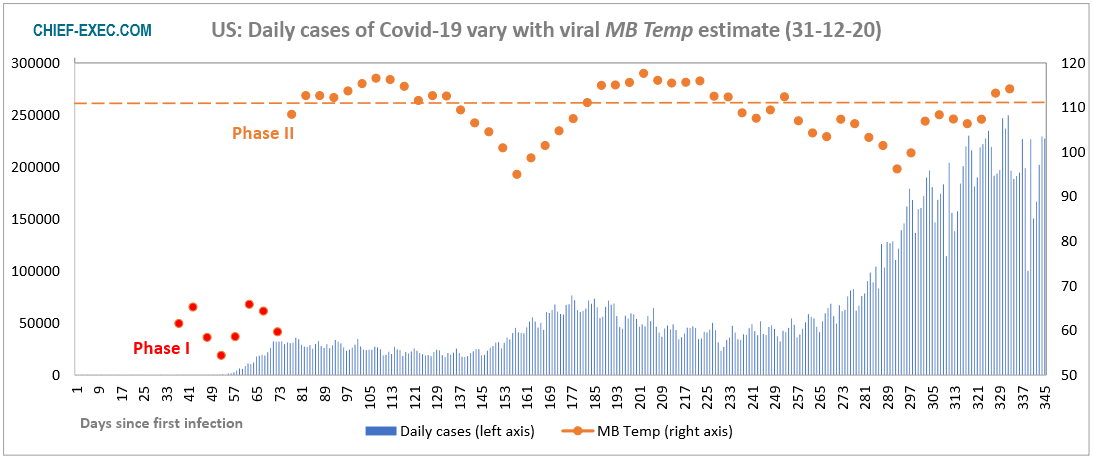
We have previously reported on the correlation of the MB Temp values with the devastating waves of Covid-19 infections that have struck the United States. The above chart provides an update with the latest data showing the continuous growth of the most recent wave breaking all records for the country. However, a glimmer of hope for the future may be gleaned.
For the first time in 75 days, MB Temp has exceeded the 111 critical threshold and if this trend can be maintained, then some respite with a fall in infections may be expected.
Notes
[1] MB Temp is not recorded in units of Centigrade or Fahrenheit as it specifies a Maxwell-Boltzmann statistical distribution for the energy in the virus as if the virus were moving through society in a manner analogous to the movement of gas molecules in a container. As such, it is proportional to the square root of the temperature measured on an absolute scale.
[2] MB Temp is estimated from Covid-19 daily case data over a period of 25 days. The estimates are taken every five days, so that changes reflect the influence of the last five days data on the 25-day picture.
Error correction: the penultimate data point was missing on the original graphic charting The World. Corrected 06-01-21
For related articles on Chief-Exec.com : Click Here

Headline Photo Credit: Motionographer/Shutterstock.com
Data sources for the number of SARS-CoV-2 infections are:-
European Centre for Disease Prevention and Control (ECDC)
Johns Hopkins University
This data is retrieved from OurWorldInData.org.