
Does the efficacy of the test, trace and isolate programme matter in the control of coronavirus?
Earlier this year, on March 16, advice on the subject from the World Health Organization was unequivocal. WHO Director General Tedros Adhanom Ghebreyesus appealed for all countries “to be able to test all suspected cases, they cannot fight this pandemic blindfolded”. Without testing and the isolation of infected individuals the chain of infection will not be broken, he said.
On Tuesday this week Prime Minister Boris Johnson offered a different recipe to the House of Commons. In the shadow of serial failures by the United Kingdom test and trace enterprise, his preference had veered towards soon to be imposed measures to limit person-to-person contacts that create the fundamental events of virus transmission.
The coronavirus is a biological machine that is rampaging around the world and some countries are managing better to control its spread. There is an opportunity for the UK to learn from those experiences but the window of opportunity is rapidly closing.
The figures speak for themselves. European countries are facing an emerging second wave of SARS-CoV-2 coronavirus infections. Labour MP and ex-Minister for Health Ben Bradshaw questioned whether effective test and trace might account for the relative successes in Germany and Italy.
My question asking Johnson why #Germany & #Italy have far lower #covid_19 rates than us seems to have struck a nerve #covid19uk pic.twitter.com/Z351pkG4SK
— Ben Bradshaw (@BenPBradshaw) September 22, 2020
Analysis of the infection patterns in different countries by Chief-Exec.com may help to answer this question, and understand why this answer is not as straightforward as we would like it to be.
Applying a novel approach which considers a coronavirus epidemic as a thermodynamic event, rather like the boiling of a kettle, and following the energy transformations involved as described earlier in this journal, Chief-Exec.com has observed that, during the first wave, the coronavirus progressed in all 14 countries looked at through two distinct phases.
An initial exponential growth of infections occurs in Phase I, where thermodynamic modelling shows the virus to be relatively “cold”. This is shown by the value of a model parameter that quantifies the energetic state of the virus – which is described using a Maxwell-Boltzmann statistical distribution. This parameter we will call the MB Temp [1].
A second parameter is a characteristic Cluster Size for an infected population of a particular region. In Phase I even the smallest micro-cluster can be the source of a propagating epidemic, if the infection-reinfection cycle time can be proportionally quicker for the smaller clusters.
Approaching the peak of the first wave of the epidemic, these properties rapidly change into a Phase II behaviour in which the virus heats up typically to a MB Temp value of about 120, which appears to be common in all 14 regions studied. In Phase II there is a fixed Cluster Size which determines the scale of the epidemic and which remains constant and unaffected by the infection-reinfection cycle time.
The two-phase coronavirus behaviour is shown alongside the real UK coronavirus infection data in the chart below. All data used here is from the European Centre for Disease Prevention and Control (ECDC) and accessed through the excellent Our World in Data portal. The thermodynamic model described earlier in Chief-Exec.com is fitted to the data over 50-day intervals which span the full history of a national infection. The MB Temp, Cluster Size and infection-reinfection Cycle Time values shown below are those which provide the best fit to the real-world infection data from the ECDC.
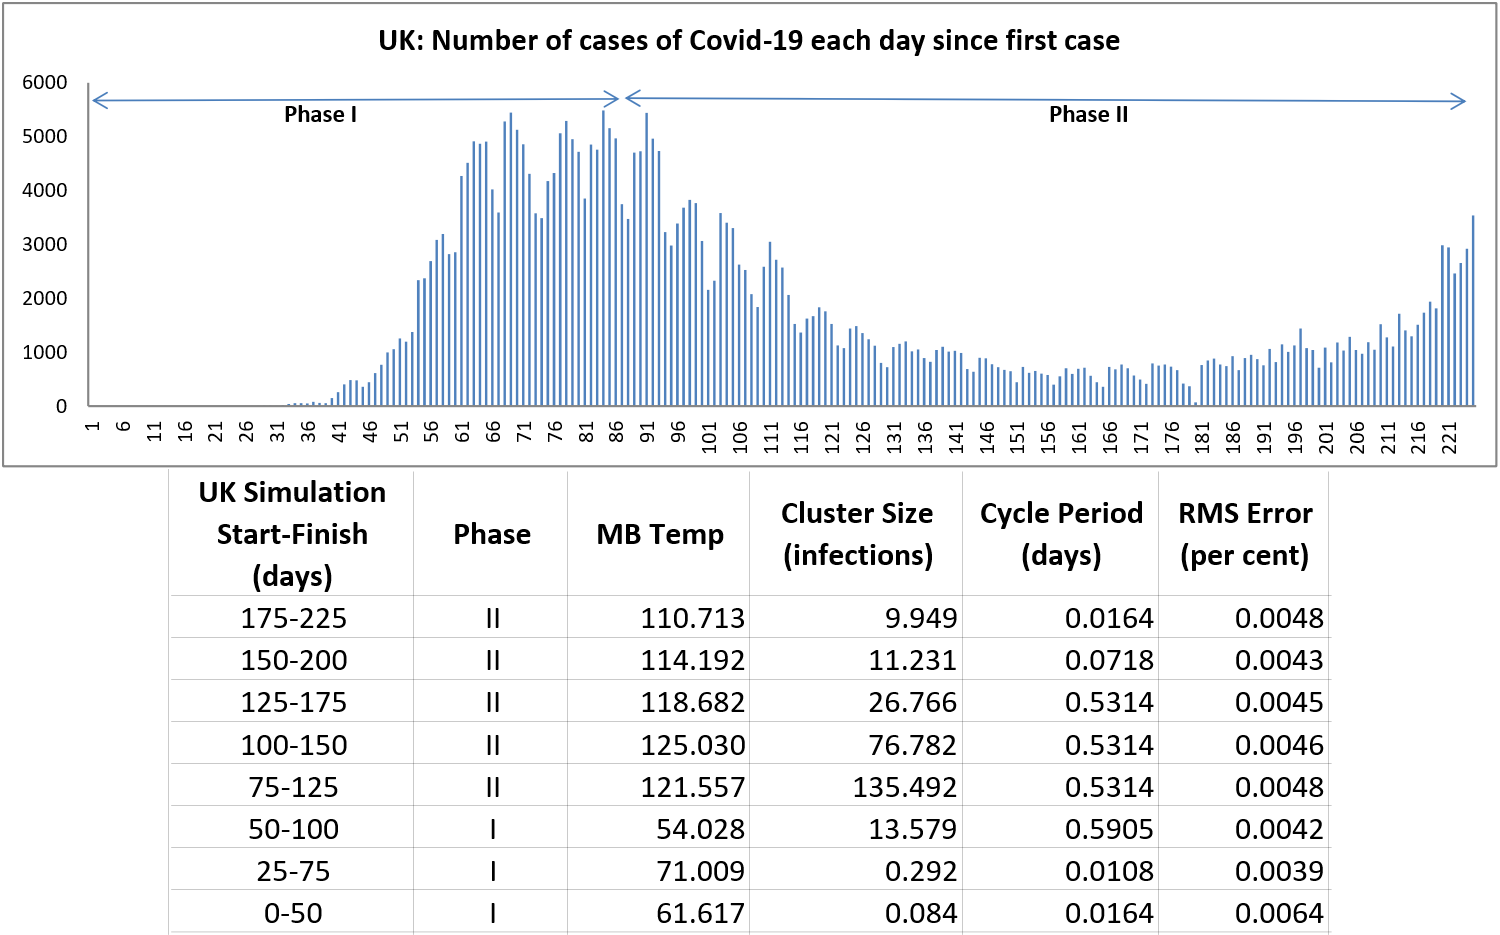
Included in the table above are root-mean square (RMS) error values which indicate a very close matching of the simulated infection with the real-world pattern of coronavirus infection in the UK.
The UK’s infection pattern now warns of an emerging second wave and measures are being taken to respond to this threat. There is much debate among scientists as to whether these measures are going too far or not far enough. Insight as to what might be in store for the UK can be found in the comparable patterns of infection in France and Spain, which are both showing a more advanced second wave.
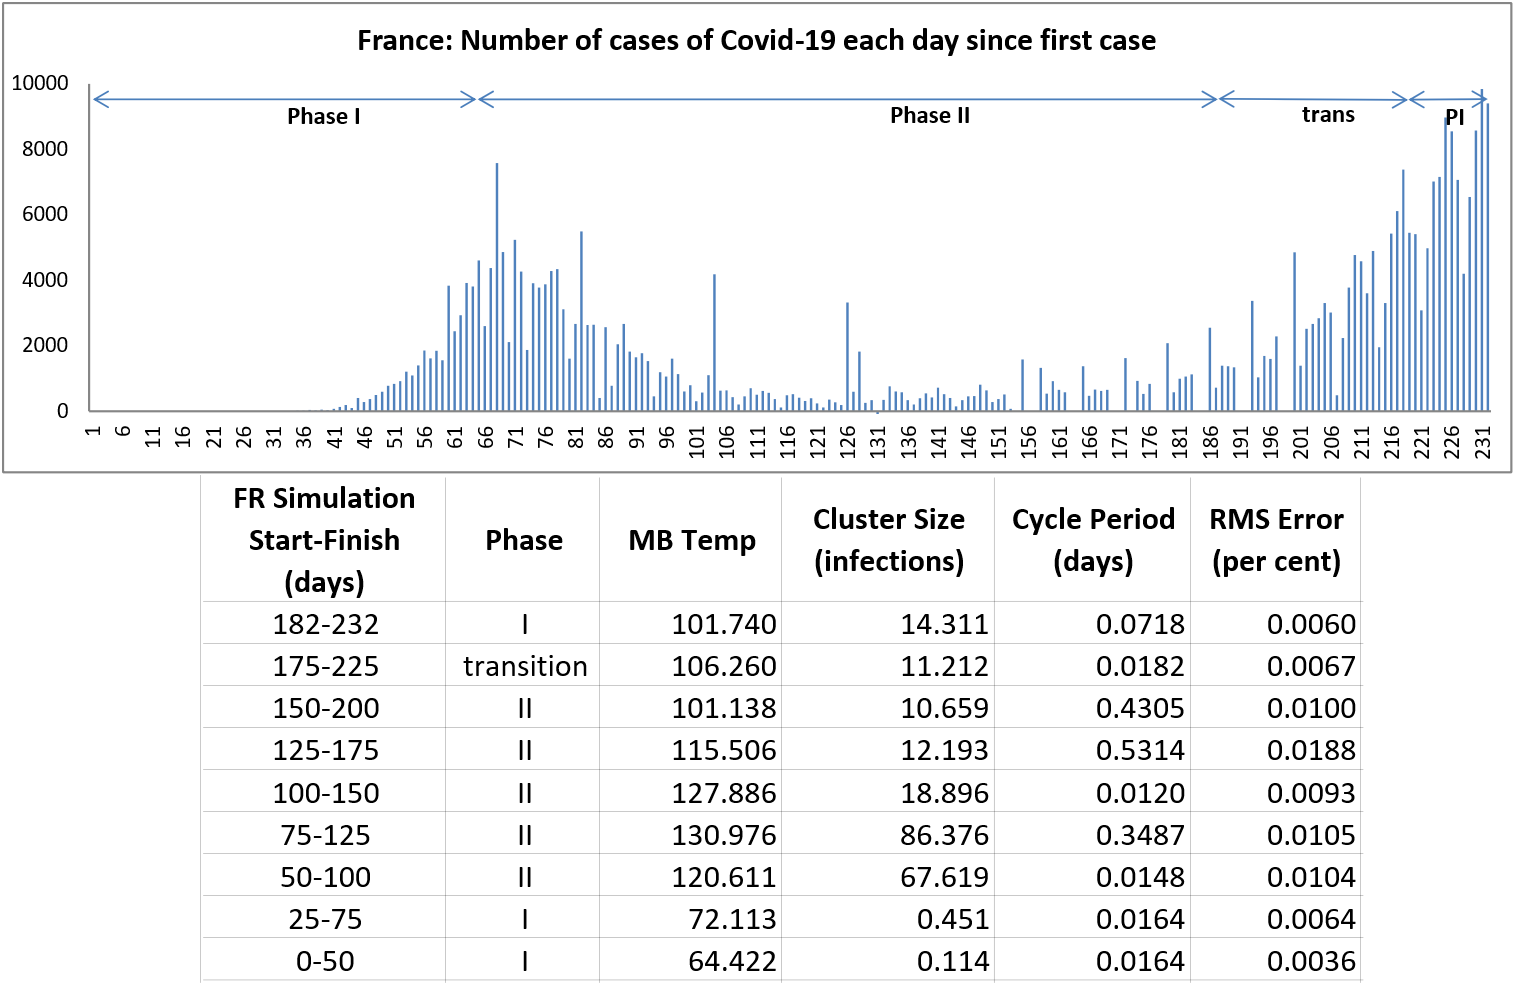

For both France and Spain, the initial Phase I interval is shorter than in the UK and both countries have a virus that has later cooled somewhat, slipping back towards a Phase I behaviour that has previously shown a capacity for exponential growth in the rate of infection [2].
Quite different scenarios appear in the infection data from Germany and Italy.
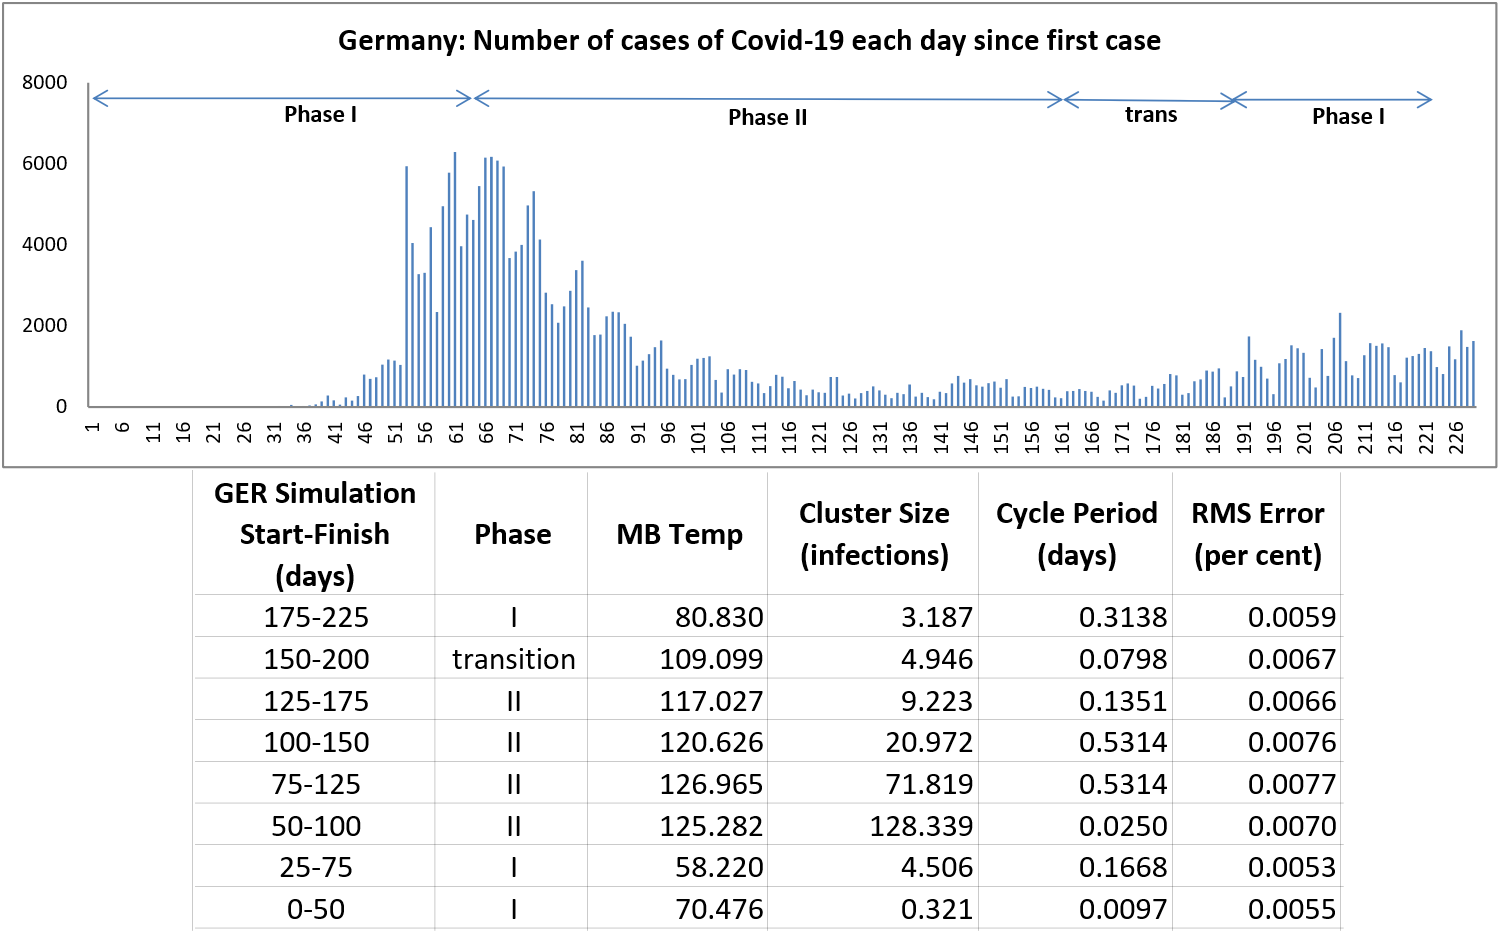

The phase changes – from I to II in Germany and Italy, and their maximum MB Temp values are similar to those of France and Spain. However, their associated Cluster Sizes are substantially lower. This appears to be a key factor correlated with the relative success of those countries in limiting the growth of the viral infections in the emerging second wave.
However, it is too early to be complacent. As long as the Phase I behaviour continues to dominate, a potential for exponential growth of new infections remains possible.
It is no contradiction that the cooler Phase I is associated with a higher potential virulence. As covered in an earlier article, the coronavirus must draw energy from infected hosts to propagate and from a thermodynamic perspective it needs to be cooler than its energy source for this to happen.
As for the UK, at the time of writing the country remains in the less precarious Phase II domain, although the virus is cooling towards Phase I. However, this in itself is not a panacea as evidenced by the behaviour of the coronavirus infection in the United States below.
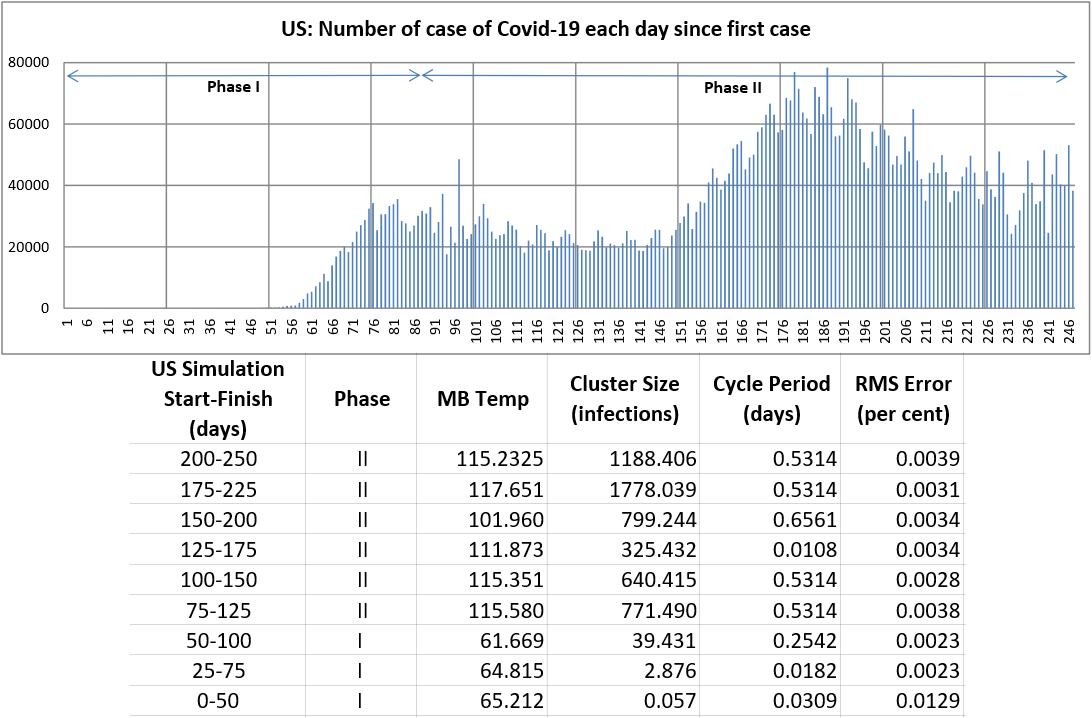
In the US the early passage from Phase I to Phase II with the corresponding rise in MB Temp is comparable with other countries. However, subsequently, the persistent Phase II behaviour is accompanied by a sharp increase in the Cluster Size values and therein lies a correlation with the high number of daily infections that the US has experienced over the course of the epidemic.
It has been said that citizens of different nations each need to recognise that the coronavirus will be omnipresent, at least until an effective vaccine becomes available, and that individuals must take the necessary steps to block its transmission. This approach aims to retain the virus in its heated Phase II state. Heating occurs with restricting person-to-person interactions with a range of measures ultimately leading to confinement and thereby limiting transmission. Conversely, cooling occurs with increasing interactions and infections.
An alternative approach would be to seek to eliminate the virus from a population – a zero Covid-19 policy. This would need the Cluster Size to be effectively reduced to zero, and subsequently avoiding new episodes of resurgence from new Phase I micro-outbreaks.
To implement either policy, effective testing and tracing with the isolation of infected individuals will be an important ingredient.
Caution should be exercised before drawing conclusions from the observations presented above. However, these suggest that the efficacy of the test and trace methods employed in Germany and Italy may be responsible for suppressing the characteristic Cluster Size in these two countries
Ben Bradshaw may well have had a valid point in his question to Boris Johnson who should take heed. Test and trace does matter.
Notes

[1] The MB Temp parameter is actually proportional to the square root of the thermodynamic temperature T, Following the statistical mechanics principles of the Maxwell-Boltzmann distribution where m represents the particle mass and k is Boltzmann’s universal constant.
[2] Note the infection data from both France an Spain is relatively noisy, resulting in higher RMS error in the fit of the infection simulation to the real world. Whilst still reasonable, this does dilute the confidence one can derive from the fit of model to data.
For related articles on Chief-Exec.com : Click Here

Headline Photo Credit:Moving Science/Shutterstock.com