The daily number of Covid-19 cases in the US has been relentlessly high, yet Canada has seen a marked fall in the number of daily infections.
On Saturday the United States reported its seven millionth person to become infected by the SARS-CoV-2 coronavirus. Three days earlier it passed the threshold of two hundred thousand dead caused by the Covid-19 disease. Today the world will see its millionth person die of this disease from among its 33 million cases. The trends show the global pandemic is not slowing down.
It has been quite a weekend for the coronavirus statistics.
In earlier articles of our Covid-19 Series we have looked at SARS-CoV-2 as a single super-organism as it infects a particular region, or indeed the whole world. Using an analysis originally deployed to study energy dissipative materials, such as the shoes that absorb the shocks of running, we have followed the flow of energy in the coronavirus through sequences of infection and propagation. In this analysis an infection is an energy-dissipating event.
In a nutshell, an infection event provides an opportunity for the virus to draw the energy it needs for its reproduction from an infected host. The number of infected people provides a measure of this energy input at any particular time. Subsequent infection events, as simulated in Chief-Exec.com’s analysis, increase the amount of available energy over a time interval that we call our cycle time. The pandemic thus grows in size with different patterns in different regions, allowing a simulation of the viral infection, reproduction and reinfection that fits these patterns.
Click here for the moving image
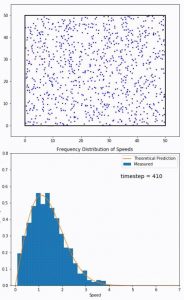
The key step in this simulation is the infection event and its consequences for the propagation of the virus. A statistical description (see left) based on the thermodynamic behaviour of gases is used to describe the probability of infection events occurring across a population.
This approach of using an energy-dissipative analysis to follow the patterns of Covid-19 infections has led to the following working hypothesis – which must be considered tentative, recognising the early stage we have reached in the analysis.
The Working Hypothesis 1
The pattern of SARS-CoV-2 coronavirus infection passes between two distinct phases analogous to the gas and liquid phases seen in thermodynamic systems. In an initial Phase I, micro-clusters of viral infections have the potential to grow rapidly and exponentially, rather like a spark starting a raging fire. If the fire gets started, which depends on the availability of external energy acquired through a propagating infection, the number of infected cases rises rapidly and the virus gets “hot”, thermodynamically speaking. If the virus cannot cool itself down, through the infection of ever greater numbers of hosts, it attains a higher and quite stable temperature and transitions into the Phase II behaviour. Now, in Phase II, the growth of viral infections depends only on the growth of a characteristic Cluster Size for the region being considered. Neither the virus MB Temp temperature nor the simulation Cycle Time affects the epidemic sequence in the same way as they do in Phase I. In Phase II the fire is burning itself out unless more wood can be found to fuel its propagation.
United States and Canada
Two examples showing the Phases I and II of the Covid-19 epidemic described above can be seen in the analysis of viral infection patterns from the US and Canada.
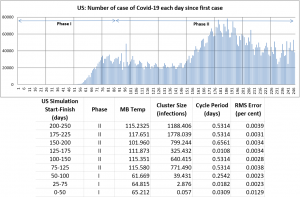
As the US passes its 250th day since its first SARS-CoV-2 coronavirus infection was recorded, it had passed from Phase I to Phase II in about 100 days and thereafter has remained in Phase II. Actually, the virus can cool down and transition back to Phase I as shown earlier.
However, the daily number of Covid-19 cases in the US has been relentlessly high. In Phase II this is associated with an increase in the estimates of the characteristic Cluster Size for the country, up to the last 50-day simulation period which coincides with a moderate reduction of daily infection rates.
A different picture emerges in the case of Canada.

Here the initial Phase I with its consequent rapid rise of daily infections occupies the initial 100 days since the first recorded infected case, as it did in the US. The transition into Phase II likewise follows. However, in Phase II the Cluster Size in Canada is seen to fall appreciably and with it the number of daily infections.
This pattern of growth in Phase I and a subsequent initial fall in daily infections in Phase II is also seen in a number of European countries. In some of these countries the initial Phase II period was accompanied by and synchronous with national lockdowns.
It is too early to associate these patterns with the actual policies used to control Covid-19 infections in different countries. More examples are needed and will be presented in Chief-Exec.com to better illuminate the effectiveness of measures such as wearing masks, social distancing and testing, trace and isolation.
For related articles on Chief-Exec.com : Click Here

Headline Photo Credit: © E-Tech Limited 2020
Simulation of a 2D gas relaxing towards a Maxwell–Boltzmann speed distribution
By Dswartz4 – Own work, CC BY-SA 4.0