A Tale of Two Statistics
Last week Oxfam ran a media campaign highlighting levels of inequality in the UK with a headline, “Richest 1 per cent owns 20 times more than UK’s poorest 20 per cent”.
These statistics found their way onto major media organisations such as the BBC and The Guardian. Their intention was to draw upon the link between rising economic inequality and poverty, in order to encourage Prime Minster Theresa May to address the former in order to combat the latter.
Notwithstanding the merits of the endeavour to combat poverty, is the UK as unequal and fractured a society as suggested, or might the statistics actually tell a different story? Could this be a case of “Lies, Damned Lies and Statistics”?
First, it might be more reasonable to compare the wealth of the highest and lowest quintiles – which the associated Oxfam briefing note actually does. The wealthiest 20 per cent of households are 100 times wealthier than the poorest 20 per cent. Inequality certainly persists, though the point is somewhat blunted.
Wealth is a measure of the total value of accumulated assets minus liabilities. Debts in poorer households are likely to have more impact on the household’s total wealth, due to wealth itself being so highly skewed towards the top percentiles. That is not to say high levels of debt do not have serious social consequences. Solutions need to address the actual problem.
The issues become more complicated by the confounding of wealth and income, which are essentially two different things. Wealth inequality is universally higher than income inequality. Of course high income earners who spend less than they earn can divert the remainder into their personal accumulated wealth.
However, wealth is also increasingly acquired through inheritance and other capital gains. Measures to redistribute such windfalls more equitably would require taxation in these areas, as well as increases in company corporation tax, something that neither the Government nor Oxfam seem inclined to propose.
Thus it is inequality in income that is addressed by the corrective measures proposed by Oxfam, despite the fact that the case for inequality is built upon the subject of wealth.
Let us put to the side, temporarily, infamous cases of massive pay hikes and bonuses for a privileged few, accompanied by equally famous cases of failures of corporate governance and employee exploitation. What story does income inequality tell for the 20 per cent highest earners compared with the 20 per cent lowest paid workers?
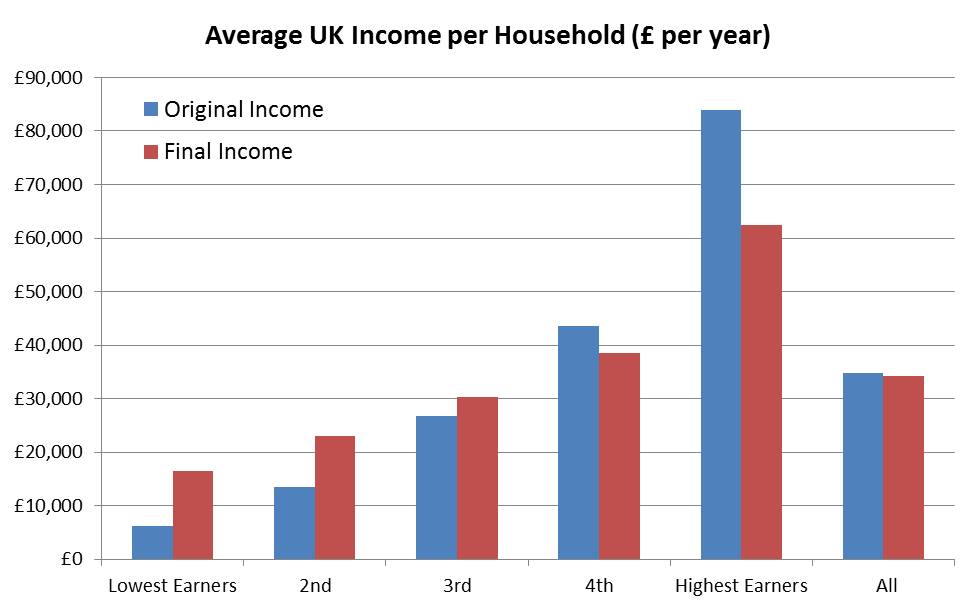
Some illuminating data is available through the Office of National Statistics (ONS). Here, one sees that in 2015 the highest 20 per cent of households had an average pre-tax (original) income of £83,800 per year, compared to £6,100 for the lowest income quintile – a large difference with a ratio of 14 to 1.
However, when all taxes and benefits, including indirect taxes and benefits in kind (for example health and education), are taken into account, the adjusted income of the highest 20 per cent fell to £62,500 and rose to £16,500 for the poorest fifth of the population. Taxes and benefits reduce the above difference to less than 4 to 1.
Individual cases of gross remuneration packages distort the real picture because they are so exceptional. But do these general averages of net income from the richest to the poorest sections of UK society really reveal such gross inequalities? Actually, in the ONS data, income inequality (Gini coefficient) in the UK appears to have fallen marginally since 1990, following its steep rise in the Thatcher years.
When all direct and indirect taxes (including VAT) are taken into account together with all benefits received by households, there is a redistribution of income of about £10,000 from the richer households to poorer households in the UK, the effect of which is to reduce inequality.
In 2015, 51 per cent of all households – which is 13.6 million households – received more in total benefits than they paid in taxes. This redistribution is possible only when innovative and productive enterprises do well, contributing to economic growth and paying significant salaries commensurate with their value contribution. It is possible that tinkering with the mechanisms, markets and motivation of business may not improve the finances of the less well off.
The Oxfam report makes an important contribution, particularly on the emphasis for up-skilling individuals to participate productively in a modern economy and gain remuneration to escape a poverty trap that is anything but new. The vast majority of businesses and business organisations would surely support this ambition.
However, a selective use of statistics linking business to inequality and poverty, whilst making more persuasive headlines, is not the way to understand the problem and identify real solutions that can address these important issues.
By John Egan