UK Prime Minister Theresa May could find herself on the horns of a dilemma
She has a problem. To quell the unrest that led to the Brexit vote she needs to address stagnation in standards of living and the increasing economic insecurity that followed seven years of austerity.
She has been handed a solution – leave the European Union (EU) and control migration of workers from the EU and the rest of the world.
A ‘Good’ Brexit scenario where this solution works to create a more prosperous UK, trading with Europe and the rest of the world, in which the UK parliament has regained control, is easier to deal with. Even the most ardent British national who wished to remain a European citizen could probably accept as consolation a life in a prosperous and united nation following a Good Brexit.
An alternative ‘Bad’ Brexit scenario, in which the hard solution the Prime Minister has adopted may not solve the actual problem and could make matters worse, would lead to a more troubling quandary.
In this case, should the Prime Minister follow the mandate of the 51.9 per cent if it becomes apparent that by doing so they, and also a majority of the 48.1 per cent, would be worse off in the long run. Or should she seek an outcome to improve the prosperity of the British nation as a whole, by thwarting the democratically expressed advice of its people.
What would you do?
The four charts that follow should help work through the options.
Chart 1
In reality, the whole UK workforce is affected by stagnation in real earnings
 Sources:
- Quarterly National Accounts: Quarter 3 (July to Sept) 2016
- Economic Well-being: Quarter 3, July to Sept 2016
- Analysis of real earnings: Jan 2017
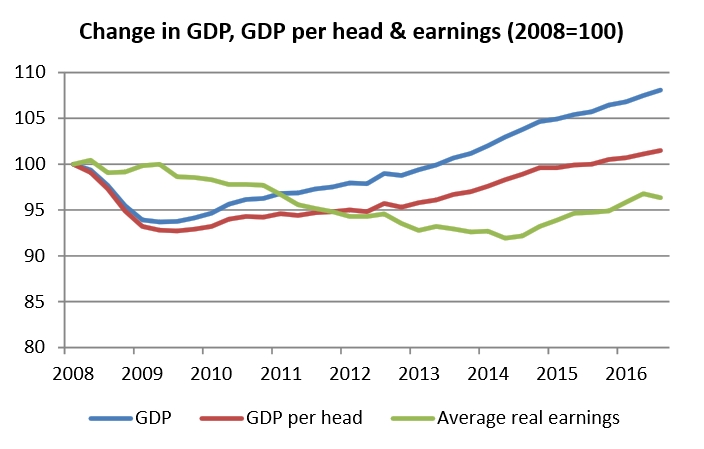
Yesterday the Office of National Statistics published the latest figures on United Kingdom gross domestic product (GDP) that has now seen four continuous years of positive growth. They were widely applauded as showing the UK, with a 2 per cent GDP increase in 2016, to be the fastest growing G7 economy.
But GDP growth, while welcome, is not the whole story.
Since the nadir of the global financial crisis (GFC) in 2009, UK GDP has seen a healthy 14.3 per cent growth. However, GDP per head tells a somewhat different story. This is a reasonable measure of the standard of living benefits brought to individuals by the GDP growth. GDP per head in the UK has only recently recovered to its pre-GFC level, and it now registers a mere 1.5 per cent growth over the past eight years. GDP per head in the UK is the same as in France and generally rather average in international comparisons.
The difference between GDP and GDP per head is that the growth of the former is due to a rise in domestic employment, together with an increase in migrant labour entering the UK workforce. There are simply more people working. About 2.5 million people joined the UK workforce between 2008 and 2016 – an expansion of about 8.5 per cent – as reported in Chief.Exec.com.
Real average earnings have lagged behind even the tepid growth shown in the GDP per head data. At the end of 2016 real earnings remained 3 per cent below their peak in 2008.
But this average earnings data disguises inequalities between groups of workers, with lower income earners doing less well, according to data presented to a 2015 Bank of England conference. Indeed, the same report highlights that the duration of the current stagnation in real wages is unprecedented in the UK economy.
Another inequality one might add relates to the difficulties of sustaining one’s lifestyle over such a long period for lower paid sections of society, who might find themselves in lower quality, more precarious employment. This inequality feeds an impression that depressed smaller urban communities in the UK are missing out on the headline GDP growth and somebody else is benefitting. In the large metropoles, in particular London, those insiders of the globalised economy are seen as the primary beneficiaries.
In reality, the whole UK workforce is affected by stagnation in real earnings. There is little additional wealth created through recent GDP growth to share out. It complicates matters further that a tightening of migration and a deterioration of trading conditions might also constrain the UK’s future economic performance (also see Bloomberg).
For a Good Brexit scenario, Prime Minister Theresa May must hope that current high levels of employment will lead to a growth of average earnings and a broader sharing of national income that, in turn, leads to a widespread perception of being better off.
While the “take back control” message of the Brexit campaign was seductive, it was sold with an assurance that this control leads to benefits for the UK citizen. If expectations of Brexit being the route to a more prosperous future are not met, the majority that favoured this option might become disgruntled. Theresa May could then face the Bad Brexit scenario dilemma.
Chart 2
It is the obstinate loss of productivity that IS the underlying problem
 Source: Labour productivity: July to Sept 2016
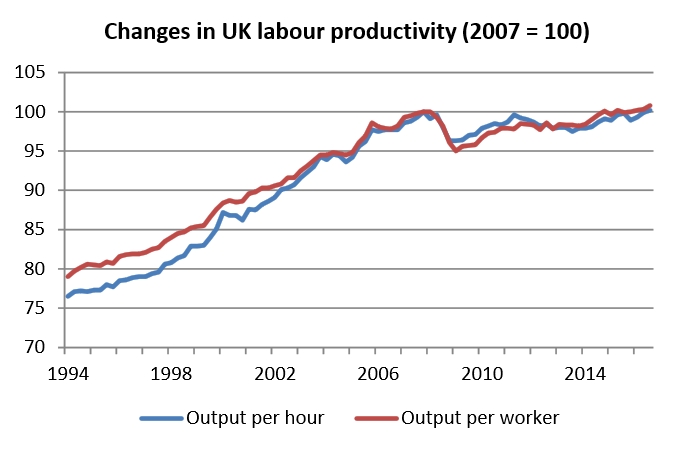
Productivity is the economic output per worker, measured by GDP output per hour or by individual worker, and the trends here tell a similar story as chart 1. Output per worker since the GFC first fell and has barely recovered to its pre-2008 level. This is in stark contrast to its almost incessant rise since at least 1970 and the reasons for this worrisome lack of productivity growth remain largely unknown. This is the subject of a “productivity puzzle” that was described in Chief-Exec.com in October last year.
Productivity is determined by labour quantity and quality, the proportion of capital available and a third factor (the total factor productivity) that loosely defines how technology and innovation combine to influence the productivity of labour. Essentially, if there is no productivity growth, there is no scope for growth of earnings for either labour or capital, expect if funded by producer price increases.
The new industrial strategy announced by Theresa May on January 23, combined with the Industrial Strategy Challenge Fund announced by Chancellor Philip Hammond in November, present a conventional series of innovation, regional development, infrastructure and skills development policies to address the UK’s lost productivity. A similar package of government intervention is envisaged in the United States as Donald Trump aims to “make America great again”.
It is the obstinate loss of productivity that IS the underlying problem for the UK economy. Educating and training a workforce is an essential skills development to achieve productivity growth, but this will take time.
For a Good Brexit, Theresa May must rely on the effectiveness of her regeneration policies and the patience of the British public.
Chart 3
Redistribution of income through the tax and benefits system makes the UK a more egalitarian society
 Source: Household disposable income and inequality in the UK: financial year ending 2016
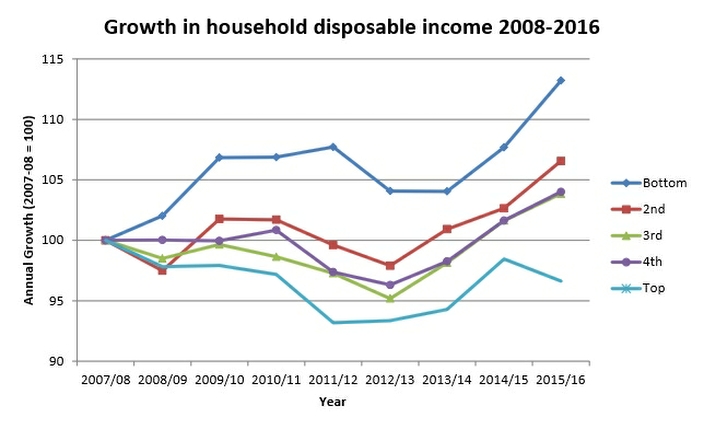
Disposable income is the final income after taxes have been taken and benefits have been reimbursed, and the chart shows this for five groups according to disposable income (quintiles) from the lowest income to the highest. Here we see that over the nine years to 2016, the lowest income households have seen their disposable income rise by 13.2 per cent, while the highest paid households have yet to reach the disposable income they had in 2007. The 60 per cent of households between these extremes show an intermediate effect.
Of course, higher paid households are more insulated from economic insecurity. However, this chart exposes a myth that certain professions, possibly the most highly paid, might see their salaries grow disproportionately to the detriment of their poorer fellow citizens. This view is given credence by the highly publicised and huge pay rises for some senior managers of large corporations. Such extremes are not so frequent as to be considered a widespread inequality in UK society.
In fact, there is a redistribution of income whereby 48 per cent of the highest income earners effectively subsidise through the tax and benefits system 52 per cent of the lowest income households. As reported earlier in Chief-Exec.com, a 14:1 ratio in gross earnings between the highest and lowest households is reduced to 4:1 in disposable income after taxes and benefits are taken into account.
Chart 3 shows that the progressive redistribution of income through the tax and benefits system makes the UK a more egalitarian society than it appears when gross earnings only are considered. This redistribution of income will become more difficult to maintain if the UK economy suffers a significant loss of tax revenue due to a fall of GDP making the Bad Brexit scenario more likely.
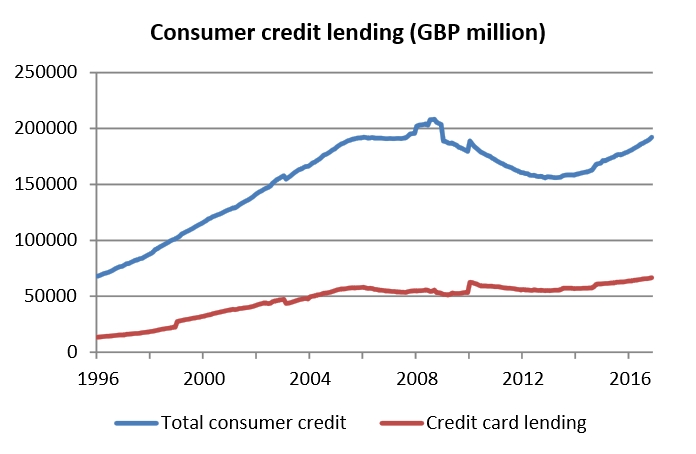
Chart 4
In the background, appearing like a ticking time-bomb, is the growth of consumer credit
 Source: Bank of England: Money and Credit – November 2016
The strong GDP growth following the vote to leave the EU on June 23 last year is often cited as evidence of the robustness of the UK economy. Employment has now reached close to a historically high level as discussed recently in Chief-Exec.com. This, together with the diminutive growth in productivity and earnings, poses a question as to what is driving current GDP growth.
Recent GDP growth has been dominated by services, with strong contributions from consumer-focused industries such as retail sales. Part of the funding of this consumer demand is an increase in consumer credit. This is growing annually at just under 10 per cent and fast approaching the level it held just prior to the GFC and the precipitating crash of Northern Rock.
Credit card lending had seen stable growth at about 6 per cent up to the end of 2015. However, in the past year, outstanding credit card lending has grown by 9 per cent.
For a Good Brexit scenario, an extension of the current consumer confidence and spending at least through the short-term will be essential to retain buoyancy of the UK economy. Ideally, the goal would then be to shift the driver for growth from domestic consumption to production and trade. Speedy negotiations with the EU and other countries on trading relations will be an important factor. In the background, appearing like a ticking time-bomb, is the growth of consumer credit. The UK saving rate has fallen towards its pre-GFC low. Inflation is set to rise and with it possibly interest rates too.
The Bad Brexit outcome could well depend on the length of the fuse.
by John Egan

